Weekend Strategy Review November 8, 2015
Posted by OMS at November 8th, 2015
Stocks closed mixed as the Jobs Report increased the possibility of a rate hike.
The Dow finished the day up 47 points, closing at 17,515. The S&P was down 0.73 cents. There were 61 new highs and 85 new lows.
Yesterday was the first session in weeks where the number of new lows on the NYSE exceeded the new highs. It was enough to turn three of the breadth indicators that make up The Tide negative. So now The Tide is neutral with the lone positive holdout being the Up-Down oscillator.
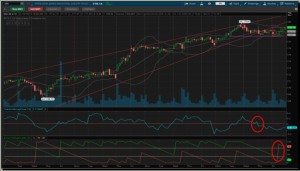
Also as shown on the attached hourly chart of the DIA, yesterday was the first time since 16 October that both the Money Flow and Arron Indicator turned negative. So it’s possible that Wave 2 up topped this past Tuesday, and everything that has happened since have been the preliminary waves of Major Wave 3 down.
The attached 15 min chart of the DIA shows a possible wave count for the start of Major Wave 3 down.
So far all of the impulsive moves to the downside have been checked and followed by retracement waves. This is usually what happens as the market starts to change direction. The market starts lower, but then traders come in buying the dips.
But if you look closely at the 15 min chart, you can clearly see that the move down since Tuesday’s top into Thursday’s low was accomplished in 5 waves. This is important to note because a move with five waves usually identifies the direction of the primary trend.
Also, the retracement from Thursday’s low appears to be a classic 3-3-5 pattern that has a small Ending Diagonal as the final leg (yellow). Moves with three waves up after a 5 wave decline are retracement waves, and NOT the start of new rally. So taken together, the five waves down followed by an a-b-c retracement (the 3-3-5 pattern) could be a sign that the uptrend that started on 29 September has ended and a new down trend is starting. We’ll see.
So things are set up for Monday. It will be interesting to see if the patterns continue to develop or will they morph into something else.
The 178 level is still the key level to watch on the Dow (DIA). So far this level has been breached 2 times only to be followed by retracement rallies. Also, the 177.75 level represents the target level (purple line) from the THT rally into Tuesday’s top. In other words, the 177.75 – 178 level represents a significant support level. So IF the DIA starts to break this level with an impulsive thrust, it’s likely that we’ll start to see a change in The Tide, the Coach’s, and the Dean’s List.
Have a great weekend.
That’s what I’m doing,
h
Market Signals for
11-09-2015
| DMI (DIA) | POS |
| DMI (QQQ) | POS |
| COACH (DIA) | POS |
| COACH (QQQ) | POS |
| A/D OSC | |
| DEANs LIST | POS |
| THE TIDE | NEU |
| SUM IND | NEG |
All of the commentary expressed in this site and any attachments are opinions of the author, subject to change, and provided for educational purposes only. Nothing in this commentary or any attachments should be considered as trading advice. Trading any financial instrument is RISKY and may result in loss of capital including loss of principal. Past performance is not indicative of future results. Always understand the RISK before you trade.

Category: Professor's Comments, Weekend Strategy Review

