
Professor’s Comments February 23, 2017
Posted by OMS at February 23rd, 2017
The markets were mixed yesterday. The Dow rose 33 points, closing at 20,777. The NASDAQ, S&P500, and Russell 2K fell 5, 3, and 6 points respectively. Volume on the NYSE was moderate, coming in at 97 percent of its 10-day average. There were 204 new highs and 11 new lows.
Yesterday’s small rise in the Dow may have been the completion of Wave 3 up within a five-wave sequence to the top of the Ending Diagonal Pattern. IF this is the case, the Dow should pull back to the 20,550 level during the next week or so, before final Wave 5 re-tests the current highs. The NASDAQ and S&P500 should see a similar pullback before rallying again into mid-March. The Russell 2K small cap index might have reached its final top. The pattern on the small cap index does not require any more upside.
Yesterday I received an interesting mail from Mike N. asking about the new Sector Rotation Strategy. I thought I would share Mike’s email and my response with everyone this morning. Here’s Mike’s email:
“I am curious if you’re using ETFs to track the good/bad sectors listed in the status report. If you are, would it too cumbersome to list their tickers?
For example, in today’s status report you noted Media as having a high negative delta score and PBS (media ETF) is on the Dean’s list.
I realize the Dean and the sector algorithms are very different but it would be reassuring to know I’m looking at the correct ETF for a possible short.
Since my enrollment, the Dean has been major focus and I’d hate to bet against him, unless the sector analysis is predicting otherwise.”
Here’s what I wrote back to Mike:
“To answer your question, yes, I have been trading a few ETFs in strong sectors highlighted in the Sector Report. However, I am also cross checking these with their position on the Dean’s List. I have not mentioned this in my daily Comments because I am still evaluating most of these ETFs.
At this point, I’m not concerned about the profits I’ve made on the Upside. Because the Sector Report has been so strong, you would have done well in almost any of the 15 strong sectors that have been consistently on the Sector Report List. It wasn’t just the top 3 that did well; all of the top 15 did pretty much the same. The big difference was in avoiding the weak sectors. If you just avoided the weak sectors, you did very well. If you staying in a few of the strong sectors and avoided the weak sectors, you outperformed the S&P index. It didn’t seem to matter much as to what particular sector ETF I chose, it was more about being in the right sector.
Right now, I’m focusing most of my attention on the downside. This is because there are a lot more positive sector ETFs, than inverse ETFs, so to take advantage of the decline that I foresee coming after March, I need to identify a few good inverse ETFs, so my students don’t have to short the individual sector ETFs. Most of my students are still uncomfortable shorting stocks and ETFs.”
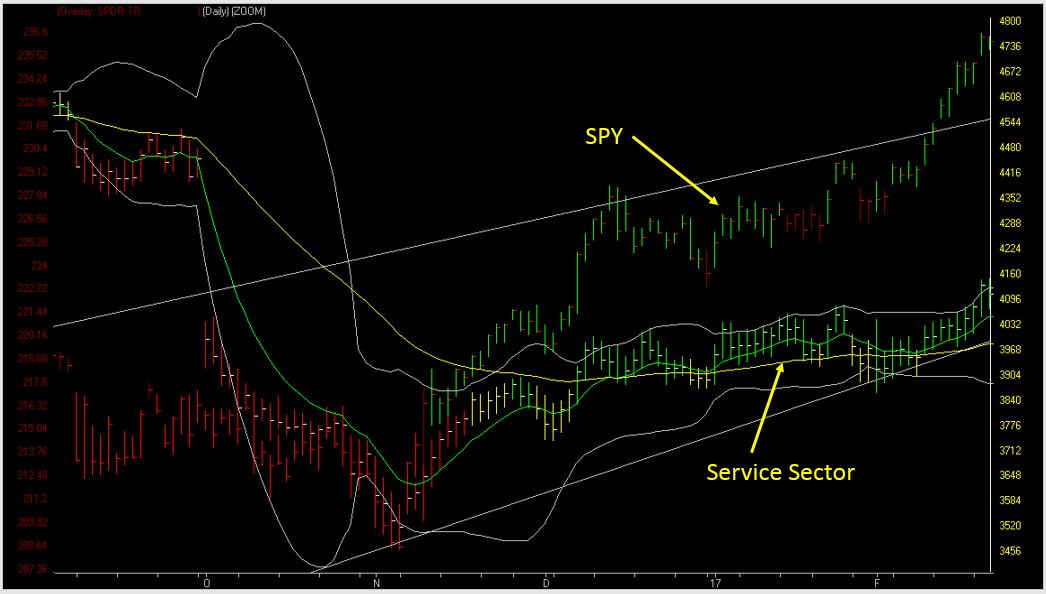
I’m attaching a chart of the Service Sector vs. the S&P500 (SPY) to today’s Comments so students can see how the sector lagged during the rally from 2 November. The Food Sector, which also was identified as a weak sector since November, has a similar chart. It pay$ to stay in strong sectors.
Also, I’m also very impressed with the results I have achieved using the VTI as the primary trigger indicator and then trading strong sectors when the VTI is showing a positive bias (>50). Then if the VTI enters the Up Trend Mode (>70), that’s when the fun begins.
Yesterday’s Sector Report showed 20 strong sectors and 4 weak sectors. The Semiconductors, Transports, and Banks continue to lead, with Food, Service, and Telecoms lagging.
Gold was flat again yesterday. GLD rose 0.07 cents to 117.91. GDX fell 0.29 cents to 24.33. The VTI on GDX remains in the Trend Mode, but continues to move down. This typically happens when an ETF is forming a wave 2 Blade within a major (wave 3 Up) Uptrend.
BTW, the 2-period RSI is now oversold on GDX with the ETF in an Up Trend (50>200). I’ll be watching the shorter-term bars for a Rifle Trade.
That’s what I’m doing,
h
Market Signals for
02-23-2017
| DMI (DIA) | POS |
| DMI (QQQ) | POS |
| COACH (DIA) | POS |
| COACH (QQQ) | POS |
| A/D OSC | |
| DEANs LIST | POS |
| THE TIDE | POS |
| SUM IND | POS |
| VTI | POS-T |
One hour video recorded from May 28, 2016 The Professor’s Signs of a Major Market Turn – Prospectives and the Projected Timing and Levels One hour streaming video – includes webinar handouts The Professor usually holds an update class whenever the Market looks like it may be making a major turn. If you have been following the Professor’s Comments you know that a turn is due….. LEARN MORE
Not sure of the terminology we use? Check out these articles
The Hockey Stick Pattern
The Creation of Waves and Trends
FAQ
All of the commentary expressed in this site and any attachments are opinions of the author, subject to change, and provided for educational purposes only. Nothing in this commentary or any attachments should be considered as trading advice. Trading any financial instrument is RISKY and may result in loss of capital including loss of principal. Past performance is not indicative of future results. Always understand the RISK before you trade.

Category: Professor's Comments