
Weekend Strategy Review October 26, 2014
Posted by OMS at October 26th, 2014
On Friday, I received an interesting email from Todd B. with the following question. Todd asked: “Am I being cynical in thinking that the markets are being manipulated in advance of the election? I’m sorely tempted to buy a couple of hundred shares of DDM just because I think Wall Street won’t allow a down day to occur in the period leading up to NOV 4 so as to not damage prospects for the Democrats.”
Hmmm? Todd might have a point. The recent rally does suggest that the Plunge Protection Team might quietly be at work. The PPT, officially known as the President’s Working Group on Financial Markets, was established in March 1998, just after the market crash of 1987.
The Working Group consists of representatives from the Fed, Treasury, SEC, and the Commodity Futures Trading Commission. Its official purpose is to enhance the integrity, efficiency, orderliness, and competitiveness of our Nation’s financial markets and maintain investor confidence. However some have charged that in the past, the PPT has been used to intervene in market plunges by buying stock market index futures contracts either in cooperation with major banks or through trading desks at the U.S. Treasury or Federal Reserve.
I won’t comment on whether the PPT has been active during the past week, but with a major election for control of the Senate only weeks away, I wouldn’t be surprised if the buying that caused the current rally is politically motivated.
Anyhow, Friday’s 128 point rally took the Dow above 16,800. I found it interesting that most of the recent action has been focused on Big Cap Dow stocks. For instance, TWM, the inverse Russell 2K ETF, only fell 0.20 cents on Friday. This tells me that there was little interest in buying the smaller cap issues. If I were a member of the PPT, I would ignore the small caps entirely and focus only on Dow stocks. Hmmm, maybe Todd is on to something after all?
Ok, so where are we now?
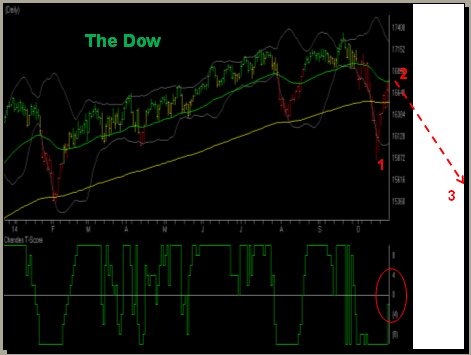
Well, the Wave 2 pattern for the Dow is still intact, and its DMI remains negative. The DMI on the NASDAQ (QQQ) has turned positive, but its MACD remains negative. So while the PT indicators are getting very close to turning positive, they haven’t turned yet.
The Dean’s List and the Tide have turned positive, but the PT indicators on most of the stocks and ETFs on the List are still negative, so I really can’t go on a buying binge.
With mixed Lists and indicators, and a pattern that still suggests that Wave 2 up should be completing at any time, I have to sit tight and remain patient.
So that’s my strategy for the weekend. Truth be told, even as I watch a positive Dean’s List and an incoming Tide, I have no idea as to what the pattern is IF a new rally leg is beginning. The only possible alternative to a Wave 2 pattern is that the larger Ending Diagonal Pattern is NOT complete. But IF this is the case, I don’t know how to explain the downslide that took place in mid-October. It is far more likely that the recent retracement is a wave 2 of the wave 1 downslide than anything that can be associated with the Ending Diagonal. The Ending Diagonal had 5 distinct waves associated with it, breaking down after the 5th wave completed. This breakdown was EXACTLY what it was supposed to do. And then when the break down occurred, it did so in 5 distinct waves for Major Wave 1 down…just like it was supposed to.
Then once Wave 1 down completed, Wave 2 Up started to develop. It too has performed EXACTLY as anticipated, forming a 3 wave zig-zag pattern. The only fly in the ointment is that the retracement has exceeded my expectations for a normal 62 percent retracement. But this can and does happen. It can easily happen if the PPT is at work buying Dow stocks to manipulate the market so it looks good ahead of an election.
But just because the retracement goes further than expected, it doesn’t change anything. The odds are still overwhelmingly in favor of a wave 2 scenario.
So with negative PT indicators still showing on the Dow and a Chandes T-score still supporting a down trend, I’m just holding my cards. The A-D oscillator came in with its second consecutive day of EXTREMELY overbought readings (>200). And even if the PPT is active, they too will have to fight these EXTREME overbought readings to keep the market well bid.
Have a great weekend.
That’s what I’m doing,
h
| Market Signals for 10-27-2014 |
|
|---|---|
| DMI (DIA) | NEG |
| DMI (QQQ) | POS |
| COACH (DIA) | POS |
| COACH (QQQ) | POS |
| A/D OSC | |
| DEANs LIST | POS |
| BREADTH | POS |
All of the commentary expressed in this site and any attachments are opinions of the author, subject to change, and provided for educational purposes only. Nothing in this commentary or any attachments should be considered as trading advice. Trading any financial instrument is RISKY and may result in loss of capital including loss of principal. Past performance is not indicative of future results. Always understand the RISK before you trade.

Category: Professor's Comments, Weekend Strategy Review