Weekend Strategy Review November 1, 2015
Posted by OMS at November 1st, 2015
While it’s still too early to tell if Friday’s trading action was the top I was looking for, it had several things going for it.
The first was the high of 17,800 made near the 2pm mark. In Friday’s Comments, I talked about a target near 17,850, plus or minus 50 points. Friday’s afternoon high reached 17,799.96, hitting the lower limit of my target.
After the high was reached, the Dow immediately started an impulsive decline, which is what I would expect to see if Major Wave 3 down was starting. It’s too bad that the decline started so late in the day, because it would have been nice to see where it would complete.
In the final two hours of trading, the Dow lost 115 points. It actually lost almost 30 points in the last minute of trading, which is never a good sign if you’re Bullish. That’s because it’s almost always the big institutional investors who are the ones selling late in the day, and they are usually right.
The late selling did not change any of the breadth indicators that make up The Tide or any of the other cockpit indicators, so we’ll have to wait until Monday to see if they start to turn negative.
I’m attaching a 5 minute chart of the DIA, so you can see how the short term indicators started to turn negative at the 2:25 bar. If you were watching these bars, they would have put you in a nice short term trade.
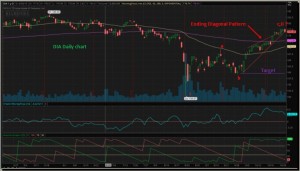
I’m also attaching a Daily chart of the DIA, so you can see the Ending Diagonal Pattern I have been talking about. Friday’s decline actually broke through the lower trend line of this pattern. The target for a trend line break after the completion of an Ending Diagonal is always where the pattern began, so in this case it’s near the 160 level on the DIA, or 16,000 on the Dow.
As a homework assignment, you might want to look at an hourly chart of the DIA and look at how the Money Flow indicator turned negative. You should also notice that the Aroon is still positive, so the down tend has not been confirmed. You might want to look at some of your other stocks on the hourly bars to see what they are showing.
For example on CNI, one of the stocks I have established a small ‘trial’ short position, the Money Flow and Trend indicators the 15s are now negative, but the Trend indicator is still positive on the 60 min and Daily Charts. So it’s still early.
You might want to watch these or similar indicators on your stocks to see if they are showing the start of a down trend.
There was a small change in the A-D oscillator on Friday, so once again we need to be on the lookout for a Big Move early in the week. If Friday’s late impulsive action continues, there is a good chance the top is in.
Anyhow, it’s a start. Let’s see what happens on Monday.
Have a great weekend,
That’s what I’m doing.
h
Market Signals for
11-02-2015
| DMI (DIA) | POS |
| DMI (QQQ) | POS |
| COACH (DIA) | POS |
| COACH (QQQ) | POS |
| A/D OSC | SM CHG |
| DEANs LIST | POS |
| THE TIDE | POS |
| SUM IND | POS |
All of the commentary expressed in this site and any attachments are opinions of the author, subject to change, and provided for educational purposes only. Nothing in this commentary or any attachments should be considered as trading advice. Trading any financial instrument is RISKY and may result in loss of capital including loss of principal. Past performance is not indicative of future results. Always understand the RISK before you trade.

Category: Professor's Comments, Weekend Strategy Review

