
Weekend Strategy Review July 24, 2016
Posted by OMS at July 24th, 2016
The Dow rose 54 points on Friday, closing at 18,571. It was up 54 points for the week. The NASDAQ finished up 26 points on Friday and up 71 points for the week.
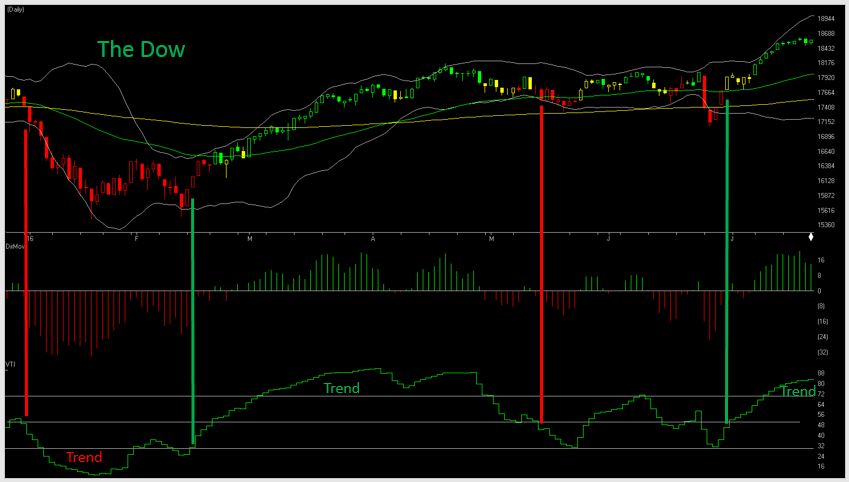
They say a picture is worth a thousand words. So in keeping with the strategy theme for this WSR, I thought it might be helpful to give you a picture (a chart) of some of the indicators I have been talking about during the past few weeks. My intent is to show you how three indicators, the DMI, The Tide, and the new VTI relate to each other, so you can formulate your strategy for trading the market in the weeks ahead.
When I started to put the attached chart together, I only wanted to show you the difference between the DMI and the VTI. I believe the VTI offers several advantages over the DMI and I wanted to talk about a few of them. But after seeing how the VTI added benefit to The Tide, I decided to add the Tide bars so you can see this too.
BTW, several weeks ago, I showed students how the VTI can be used with the 2-period RSI Wilder. I highlighted times when the market was not trending (VTI between 30 and 70), and the 2-period RSI Wilder was at extreme overbought or oversold levels. Trades established under these conditions usually resulted in nice profit. All this was discussed in the 2 July WSR and in follow up Comments on 6 July.
This weekend I wanted you to show you several other advantages of the VTI. In particular, I wanted to show you how the new VTI can identity a change in direction earlier than the DMI, and then tell you when a trend starts to develop. These are important features, because having the ability to identify a change in direction early, even by a day or so, often results in a gain of several hundred Dow points.
For example, the attached chart shows how the VTI changed direction on 12 February at the 15,974 level. The DMI did not turn positive until 22 February, five trading days later, costing a student using the standard DMI 647 Dow points.
Both indicators told the student that the market was changing direction and heading up, but the VTI did it a lot earlier.
A similar thing happened recently when the VTI started to rise on 29 June with the Dow at 17,695. The DMI turned positive the following day with the Dow at 17,930. This one day cost a student 235 Dow points.
If you look at trades to the down side, you can see that the VTI turned negative on 28 April, with the Dow at 17,831. The DMI turned negative the following day, at a lag of 57 Dow points.
So from looking at the chart, it appears that the VTI can identify a directional change quicker than the DMI. This is a great feature, but it’s only desirable IF it can avoid whipsaws. Hey, there are a lot of indicators that can identify directional changes early. But anytime you use a fast indicator, it is usually subject to whipsaws.
This is where the VTI shines. For example, if you look at what happened on 7 April. Both the DMI and VTI were positive going into the period. But on 7 April, then the DMI turned negative for 2 days before turning positive again on 11 April. This whipsaw could have been avoided by paying attention to the VTI. The indicator was also telling students that the market was pulling back (the VTI started to head down, ) but the fact that it was still in the Trend Mode told students that the pullback was likely only temporary. Then once the VTI and DMI were in sync again on 11 April, the Dow continued to rise until 3 May when the VTI came out of the Trend Mode, allowing students to keep an extra 209 Dow points.
So besides being able to identify early directional changes and helping to avoid whipsaws by identifying times when the market is in the Trend Mode, the VTI has another advantage over the DMI. It can be used to supplement The Tide.
If you look at the four periods on the attached chart where The Tide was either positive or negative, you will see that The Tide does a very good job of telling students which side of the market to be on, either long or short. But because The Tide is only an indication of breadth, it does NOT tell you when the market is trending. So even though The Tide might be positive or negative, it does not mean that the market is trending. Trading a market with solid breadth behind a trend usually results in long runs that produces substantial profits.
This is where the VTI becomes EXTREMELY useful, because it can identify periods when the market is trending. If you know that The Tide is positive (positive breadth), and the market is trending up, you can hold or increase your positions, to take advantage of the rally. Then when the VTI moves out of the Trend Mode, you can start taking some money off the table. Putting your money at risk when the market is no longer trending is never a good strategy. Lots of bad things can happen.
Anyhow, I hope the above discussion helps you understand the differences between the DMI, VTI, and The Tide. Each indicator is very good at what it does. But when these indicators are used together and support each other, they should help you develop a very powerful strategy for trading the market in the weeks ahead.
Bottom Line: From an overall strategy perspective, I believe the market is at or approaching a very important top. All I’m doing now is waiting for the indicators to turn negative.
Have a great weekend.
That’s what I’m doing,
h
Market Signals for
07-25-2016
| DMI (DIA) | POS |
| DMI (QQQ) | POS |
| COACH (DIA) | POS |
| COACH (QQQ) | POS |
| A/D OSC | |
| DEANs LIST | POS |
| THE TIDE | POS |
| SUM IND | POS |
| VTI | POS-T |
All of the commentary expressed in this site and any attachments are opinions of the author, subject to change, and provided for educational purposes only. Nothing in this commentary or any attachments should be considered as trading advice. Trading any financial instrument is RISKY and may result in loss of capital including loss of principal. Past performance is not indicative of future results. Always understand the RISK before you trade.

Category: Professor's Comments, Weekend Strategy Review