Weekend Strategy Review January 20, 2019
Posted by OMS at January 20th, 2019
The Dow gaped higher at the open on Friday, moving beyond Thursday’s high and stopping at its 200-day moving average. The Dow finished up 336 points at 24,706. It was up 710 points for the week. The NASDAQ finished up 73 points on Friday and was up 185 points for the week.
Friday was options expiration and there was a second-day small change signal on the Board from the A-D oscillator, so the Big Move was not unexpected. But with the markets EXTREMELY overbought, the odds suggested the move would be to the down side. It didn’t happen. Instead the Dow gaped higher. It could have formed an “Exhaustion Gap”. We’ll see. BTW, this is the reason I hate Wave 2s. They always seem to have a mind of their own.
Friday’s gap opening also caused the NASDAQ to form a ‘Spinning Top candlestick pattern. Spinning tops are usually found at important turning points in patterns. Also, the Spinning Top has formed at a point where the markets are EXTREMELY overbought AND where significant moving average resistance is located. So, there’s plenty of evidence to suggest that a top is at hand. However, my market timing signals for equities remain on Buy Signals, and until they turn negative, the markets can continue to push even higher.
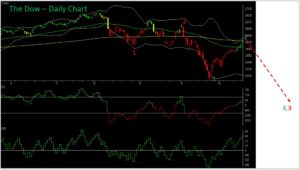
The wave count continues to suggest the current rally is Wave 2 up within Major Wave 3 down. (See attached chart). If this analysis is correct, Wave 3 of Major Wave 3 down should begin soon. ‘Soon’ is the key word. If the rally continues much longer, it has the potential to change the wave count. But at this point, I must give the alternative scenario low odds. Hmmm? What exactly is that alternate scenario?
Well, IF the current rally continues, it means that the three wave correction that occurred from the 3 October high into the 26 December low was just that…a correction. It means that we’re still in a Bull Market. I’m having a tough time buying into this, especially since the 50-day moving average has moved BELOW the 200 on all the major market indexes. Seeing the 50 below the 200 is the classic definition of a Bear Market. So, any technical analysis of the charts MUST give priority to Bearish patterns and wave counts. That’s why I still must go with the Wave 2 scenario. It would be unconscionable for me to do otherwise.
However, IF the rally does continue and the Dow begins to move above the 200, the Bullish Scenario will come into play. But for now, the Dow is being checked by the 200 and to a lesser extent, its Upper Bollinger Band. The volatility index (VIX) is also at its 200-day moving average, with its 50 above the 200.
The obvious question at this point is what could cause the Dow to move back into a Bull Market? Well, for starters, we need to look at some of the things that have caused the market to turn Bearish. The two obvious things are an unfriendly Fed and the China trade tariffs. As you know, the Fed is currently raising interest rates and selling of its balance sheet at the rate of $50 Billion per month. This is causing a tightening of the money supply. Will this go away? Not likely.
The trade tariffs with China are a different story. Right now, the tariffs are impacting the economies of both China and the U.S. Chinese trade reps are scheduled to visit Washington on January 30. They have given indications that they are willing to cut tariffs on imported U.S. soybeans. So far, the U.S. wants more concessions and is sticking to its hard line position. The Presidents Team has only agreed not to increase the percentage rate to 25% from 10% on some $250 billion worth of imports. The two sides have until March to work things out, otherwise the tariffs will increase. So, will the issue with trade be resolved? If it is, the markets could rally 3-5 percent in short order. If the tariff issue is not resolved, and the higher tariffs go into effect, this alone could cause equities to fall another 10-15 percent.
The last elephant in the room is the government shut down. Right now, with 800,000, federal workers on a paid holiday (Congress says they will receive back pay), the economy is starting to slow. The White House estimates that economic growth will be cut about 0.13 percent for each week the government is closed. BTW, only 20 percent of the government is closed. But even with 20 percent closed, the shutdown is reducing GDP growth rate by about 0.5 percent each month. So, given that last quarters GDP growth was about 2.5 percent, we could see a 1st quarter growth rate near 1 percent IF the shut-down continues into March. This would definitely impact the equity markets. However, impacts of the shut-down will be felt long before that.
One study I recently saw shows that 40 percent of adult Americans do not have enough funds to cover a $400 emergency. Think about that for a moment. If it’s true, many people will have to start pawning items and selling cars to raise cash long before March. Without 800,000 Feds and their contractors traveling, airline earnings will be reduced. If the shutdown continues into March, food stamps will be cut. This will impact the earnings of grocery stores like Walmart, Kroger, and Safeway.
Bottom Line on the shut-down: If it continues, the shutdown will impact consumer confidence and consumer spending which is 68 percent of the American economy. Any reduction in consumer spending ALWAYS impacts the equity markets. So, the question is when will the shut-down be resolved? Only Pelosi, Schumer, and the President can answer this. I can’t help you here.
Bottom Line on the markets: We have arrived at a critical cross road. There are at least three major factors on the table now, with Brexit being a fourth, that could impact the next major move in the markets. As most of you know, I have been waiting for the 35-period CCI on the Dow to give me answers. For the past few weeks, the 35-period CCI has been positive. It’s been a great indicator in calling the current rally. So, here’s the deal…
If the CCI starts to turn negative next week, I’m going to follow it and buy inverse index as they appear on the Dean’s List. At this point, with the odds favoring a negative outcome on at least 2 of the 4 issues I discussed above, AND with EXTREME overbought conditions and the markets at moving average resistance, I still MUST favor a downside outcome.
If my Bearish view begins to change, I’ll let you know.
Have a great weekend.
That’s what I’m doing,
h
U.S. markets will be closed Monday, 21 January, for the Martin Luther King Holiday.
Market Signals for
01-22-2019
| DMI (DIA) | POS |
| DMI (QQQ) | POS |
| A/D OSC | |
| DEANs LIST | POS |
| THE TIDE | POS |
| Index | Signal | Signal Date |
|---|---|---|
| DOW | POS | 08 Jan 2019 |
| NASDAQ | POS | 07 Jan 2019 |
| GOLD | NEU | 18 Jan 2019 |
| U.S. DOLLAR | POS | 18 Jan 2019 |
| BONDS | NEG | 18 Jan 2019 |
| CRUDE OIL | POS | 08 Jan 2019 |
Only getting the Professor’s Weekend Review? Try his daily update Cum Laude service for 2 weeks only $9.99 LEARN MORE
All of the commentary expressed in this site and any attachments are opinions of the author, subject to change, and provided for educational purposes only. Nothing in this commentary or any attachments should be considered as trading advice. Trading any financial instrument is RISKY and may result in loss of capital including loss of principal. Past performance is not indicative of future results. Always understand the RISK before you trade.

Category: Professor's Comments, Weekend Strategy Review


