Weekend Strategy Review February 27, 2016
Posted by OMS at February 27th, 2016
The Dow fell 57 points on Friday, closing at 16,640. It was up 190 points for the week. The NASDAQ was up 8 points on Friday and up 94 points for the week.
Friday’s pullback in the Dow could have been the start of a corrective wave 4 within the Ending Diagonal pattern to complete Major Wave 2 up.
After an opening pop to the 16,796 level, the Dow spent the rest of the day in a slow steady decline that appeared to be correcting the gains of the previous two days.
In Friday’s Comments, I mentioned that I expected the Dow to rally to the 16,850-16,900 level before pulling back to correct the advance. But at this point, I can’t be sure if Friday’s decline was the start of a corrective wave 4 or a minor corrective wave within wave 3 up. Doesn’t really matter because the correction should be very close to completing and the market should rally early next week.
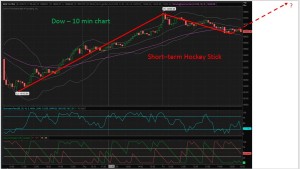
One of the reasons I say this is because of the short-term pattern that has developed on the shorter-term bars. The rally since Wednesday’s low of 16,166 into Friday’s high of 16,796 and subsequent pullback has formed a picture perfect Hockey Stick pattern. The ‘Stick’ portion of the pattern has a total of 630 points. So depending on where Friday’s ‘Blade’ ends, it should help us provide us with an estimate of where the Ending Diagonal Pattern to complete Major Wave 2 up will end.
Right now if I add the 630 points of the ‘Stick’ to Friday’s low, it projects a target of 17,254. This target would suggest that the Ending Diagonal will have a through over wave before it completes.
For now, I’m still gonna stay with my target of 17,000. But I do find Friday’s Hockey Stick very interesting.
One of the things I will be doing when the market opens on Monday is watching thisHockey Stick pattern. If the Dow starts to move higher on the 10 min bars, I’m going to take the trade. Remember, Hockey Sticks are continuation patterns and anytime I see them occur on the short term bars, I’m always looking for a trade.
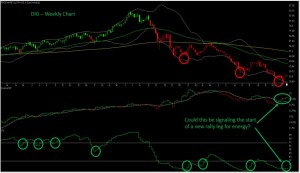
The other thing I’ll be watching is energy. The attached weekly chart of chart of DIG, the oil and gas ETF shows that a clear TLB Pattern has developed. The Money Flow indicator is positive, but more importantly, my custom Volume Trend Indicator (VTI) has just turned positive. If you look at this indicator closely, you will notice that almost every time it turns positive, it usually leads to a rally that lasts for at least 2-3 weeks.
So going into the extremely favorable March-April time period for energy, it’s nice to see this indicator starting to move up.
Gold stocks declined on Friday in what appears to be the start of the wave 2 pullback. Since the DMI and Money Flow indicators on GDX turned positive on 25 January, the advance in the ETF has ben almost straight up. But Friday’s decline caused the Money Flow indicator to turn negative again. This is one of the things I have been waiting for. So now I’ll be watching gold stocks to see if a ‘Blade’ develops for wave 2.
The thing to note about the recent rally in GDX as it rose from 13 to just shy of 20, is that it caused the 50 day moving average to move to from a down trend to a point where it is now even with the 200. This is a very significant development for gold. So if GDX can stay above the 50 as it pulls back during the next week or so to form a ‘Blade’, the 50 will likely cross above the 200 putting the ETF into an up trend. If this happens, I will start accumulating shares of GDX and other gold stocks as gold could be ready to move significantly higher.
Remember, as long as a stock or ETF is in a downtrend (50<200), the Professor’s Methodology only allows trial positions. But once the stock starts to move into an up trend, I start to accumulate and hold shares.
So IF GDX pulls back to the 16-17 level, I will be looking for entry points on the shorter term bars.
Have a great weekend.
That’s what I’m doing,
h
Market Signals for
02-29-2016
| DMI (DIA) | POS |
| DMI (QQQ) | NEG |
| COACH (DIA) | POS |
| COACH (QQQ) | POS |
| A/D OSC | |
| DEANs LIST | POS |
| THE TIDE | POS |
| SUM IND | POS |
All of the commentary expressed in this site and any attachments are opinions of the author, subject to change, and provided for educational purposes only. Nothing in this commentary or any attachments should be considered as trading advice. Trading any financial instrument is RISKY and may result in loss of capital including loss of principal. Past performance is not indicative of future results. Always understand the RISK before you trade.

Category: Professor's Comments, Weekend Strategy Review


