Weekend Strategy Review April 17, 2016
Posted by OMS at April 17th, 2016
The Dow fell 29 points on Friday, closing at 17,897. It was up 321 points for the week. The NASDAQ was up 8 points on Friday and up 88 points for the week.
It appeares that Friday’s decline was wave ‘d’ of a small Ending Diagonal Pattern for wave 5 up of Major Wave 2 up. If this is the case, the Dow should make one more small rally wave up to complete the pattern before prices start to fall hard. However students should remember that the final wave of an Ending Diagonal often truncates, so final wave ‘e’ up may or may not materialize.
The negative divergences in Volume and Money Flow I have been reporting for the past few weeks continue to develop and are now at extreme levels. Divergences like these are a warning that a top of major significance is approaching. I would not be surprised to see the decline start early next week. Please be careful now. While early next week could see a lot of cheering as the Dow tests the 18,000 level, I don’t believe those sounds of happiness and joy will last very long.
Also, as the equity market has pushed higher, gold appears to have completed the ‘b’ wave of an a-b-c pattern for corrective wave 2 down. The negative divergences in Volume and Money Flow that are apparent in the equity markets are also very apparent in gold now. Only while these indicators are still positive on the equity indexes, they are now negative on gold.
Because of this, I still expect to see gold trade near or below 1,200 with a decline to the 1,050 -1,070 level possible. It is also possible that corrective wave 2 down in gold has completed or will complete near current levels. But with negative Money Flow indicators, I doubt it. I’m thinking that the final wave ‘e’ up in equities will put pressure on gold sending it slightly lower.
GLD closed at 117.92 on Friday. I am looking for it to trade closer to 110-111 before I become interested in buying. Again, I’m watching gold very closely now because I believe once it completes its corrective wave 2, it will be one of the best places to be in the years ahead. The next wave up in the gold rally could be significant. I would not be surprised to see gold trade between 1,900 and 2,400 before Wave 3 up completes.
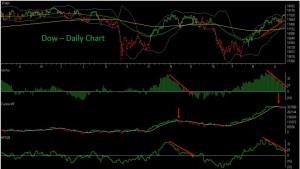
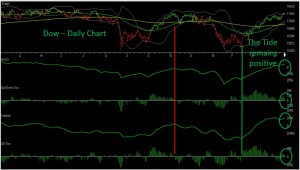
The attached two charts of the Dow show the concern I have this weekend with the volume and money flow.
The first chart clearly shows the negative divergence I have been talking about recently. As price continues to rise, it is being supported by less and less money flow and volume. In other words, the volume and money flow indicators are warning that a major top is approaching.
We saw the same thing happen happen last October-November when volume and money flow started to diverge negatively from price.
Then once The Tide turned (the second chart), it led to a 2,400 point decline in the Dow.
Right now all of the all of the breadth indicators that make up The Tide continue to remain positive.
If the market rallies early next week, you might want to pay attention to The Tide…. especially with the warning the volume and money flow indicators are giving.
That’s what I’m doing,
h
Market Signals for
04-18-2016
| DMI (DIA) | POS |
| DMI (QQQ) | POS |
| COACH (DIA) | NEG |
| COACH (QQQ) | POS |
| A/D OSC | |
| DEANs LIST | POS |
| THE TIDE | POS |
| SUM IND | POS |
All of the commentary expressed in this site and any attachments are opinions of the author, subject to change, and provided for educational purposes only. Nothing in this commentary or any attachments should be considered as trading advice. Trading any financial instrument is RISKY and may result in loss of capital including loss of principal. Past performance is not indicative of future results. Always understand the RISK before you trade.

Category: Professor's Comments, Weekend Strategy Review


