Professor’s Comments October 8, 2015
Posted by OMS at October 8th, 2015
The Dow rallied over 170 points early, then gave back all of those points before rallying into the close to finish up 122 points at 16,912. Volume was heavy, coming in at 110 percent of its 10-day average. There were 39 new highs and 13 new lows.
Yesterday’s Big Move was predicted by Tuesday’s small change in the A-D Oscillator. Actually there were three Big Moves yesterday. The first was the opening rally of 163 points. The second was the intraday decline of 198 points. And finally the 147 point rally into the close. It was a pretty volatile day.
Buried in all the volatility is the possibility that the Dow actually topped yesterday at 16,963.
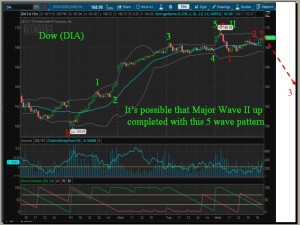
Here’s why: First of all I was expecting the Dow to top near the 17,000 level. So the initial rally took the Dow to within 37 points of that level. Secondly, by rallying up to 16,963, the Dow exceeded the 17 September high of 16,933 making 16,963 the second high of an a-b-c pattern for Major Wave 2 up. Wave 2s usually have two retracement highs. And finally, I can count five distinct waves going into yesterday’s high,. The final ‘c’ wave of an a-b-c flat pattern usually has five waves.
So once yesterday’s top was in, everything that occurred after that could have been associated with the start of Major Wave 3 down. In other words, the impulsive decline from 16,963 to 16,790 could have been minor wave 1 down, then the corrective rally into the close could have been a minor wave 2 up. If this is the case, the Dow should start dropping very soon as minor wave 3 of 1 of Major Wave 3 down starts to unfold.
The market is EXTREMELY overbought after yesterday’s rally. The A-D oscillator closed with a reading of 247.21. An A-D Oscillator reading over +200 usually results in a significant pullback the following day. Usually the only time the market does not pull back after a reading over +200 is when the market is in a major up trend. This market is NOT in a major up trend, so it should pull back today.
So for today there will be two things to watch. The first is for an impulsive pullback. If this occurs, the odds are high that it is a minor wave 3 within Major Wave 3 down. The second thing to watch is for a break of the 16,502 level. There is a small upside ‘gap’ at the 16,502 level, and the first thing I look for in a major market reversal is for a closing of the final upside gap. In Japanese Candlesticks, this is called ‘closing the windows’.
Gold took a breather yesterday, with GLD closing down 0.16 cents at 109.70. The daily Money Flow indicator on GLD is still negative, so even though gold stocks have moved higher during the current rally, the shares of the underlying metal ETF are still not attracting much attention from the institutions. I believe that this will start to change in the days ahead. Watch the Money Flow indicator on GLD.
That’s what I’m doing,
h
BTW, I’m attaching a 15 min chart of the Dow (DIA) so you can see the five waves going into yesterday’s top. You might want to look at how the market started to pull back after forming the top. It puts what happened yesterday into perspective. No guarantees…..
Market Signals for
10-08-2015
| DMI (DIA) | POS |
| DMI (QQQ) | NEG |
| COACH (DIA) | POS |
| COACH (QQQ) | POS |
| A/D OSC | |
| DEANs LIST | POS |
| THE TIDE | POS |
| SUM IND | POS |
Not sure of the terminology we use? Check out these articles
The Hockey Stick Pattern
The Creation of Waves and Trends
FAQ
All of the commentary expressed in this site and any attachments are opinions of the author, subject to change, and provided for educational purposes only. Nothing in this commentary or any attachments should be considered as trading advice. Trading any financial instrument is RISKY and may result in loss of capital including loss of principal. Past performance is not indicative of future results. Always understand the RISK before you trade.

Category: Professor's Comments

