
Professor’s Comments October 24, 2019
Posted by OMS at October 24th, 2019
The markets rose moderately yesterday after declining on Tuesday. The Dow finished with a gain of 45 points, closing at 26,834. The NASDAQ and SPX were up 15 and 9 points, respectively. Volume on the NYSE was 103 percent of its 10-day moving average. There were 143 new highs and 28 new lows.
A few of the market timing indicators turned Neutral since Tuesday’s session. Neutral is NOT a Sell Signal, so I didn’t post comments about the change yesterday. The indicators on the Dow, NASDAQ, and SPX have turned Neutral.The indicator for the Russel 2K remains Negative.
Most of my timing indicators are now at a point where they are close to the zero lines. This means that we could see a Signal change within the next day or so.
The Daily DMI on the Dow, NASDAQ, and SPX remains Positive. The DMI on the RUT remains Negative.
The Dean’s List remains Neutral with a Positive Tide.
The market remains in a very fragile condition. With mostly neutral to positive indicators on the cockpit, the odds still favor a continuation of the current rally before a major top is in. That top could occur within the next few weeks.
There are two scenarios on the Board. The most likely scenario is that the Dow will rally toward the 27,400 level, break it and top somewhere between 27,500 and 27,700. The alternate is that the top is already in. In this alternate scenario, the past few days of up down up action are part of a retracement wave 4 up of Wave 1 down that began from the high of 27,112. If this is the case, the Dow should decline to the 26,600 level before all five waves of Wave 1 down are complete. I still give this scenario low odds, probably less than 20 percent. The reason I believe the first scenario will prevail is because of the Sector Ratio. It remains extremely positive after Wednesday’s session.
At 23-1 Positive, I can’t get too negative on this market with 23 out of 24 sectors moving up. The Strongest Sectors were Service, Retail, Consumer Products, Banks and Banks. The one weak sector was Household Products.
As long as the market timing indicators AND the Sector Ratio remain positive, the odds favor a move toward the July high of 27,399 and then top somewhere between 27,500-27,700 level during the next few weeks. A change in the timing indicators would negate this Bullish Scenario and likely mean that Wave ‘D’ up has truncated.
Gold (GLD) rose 0.33 cents to 140.53. The rise caused the indicators on GLD to move to a Neutral signal from a previous Sell. So, with GLD now on a Neutral signal, I’m just waiting to see if Wave 4 down is complete. If the timing signal turns positive, the Model will look to buy a few shared of gold related ETFs. Be patient and wait for the signal change.
Bonds also moved to a Neutral Signal after yesterday’s session. Bonds are at a point where they can either see a small rise or begin falling immediately. The next few days will tell. It’s still not clear if the pullback since early September is part of a Wave 4 pullback or the beginning of larger decline. Right now, with a Neutral Signal, I’m on the sidelines with Bonds.
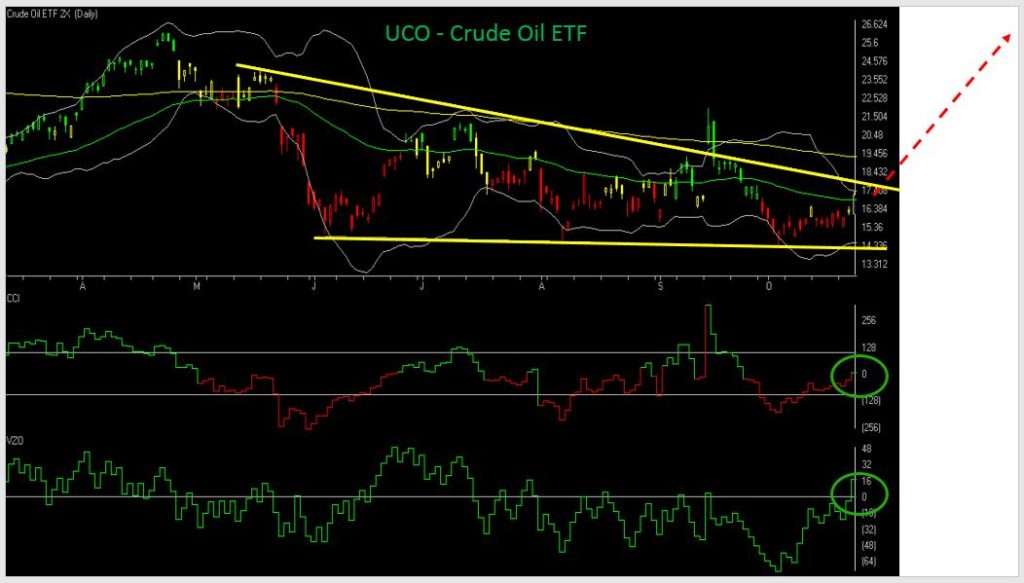
Shares of UCO (crude oil ETF) rose 0.85 cents to 17.14. The rise caused the indicators on UCO to move to a Buy Signal. Because of this, the Model will look to add a few more shares to its current ‘trial’ position in UCO on any pullback.
The pattern on UCO suggests the ETF is in the final stage of completing a major triangle pattern (see attached chart). With UCO moving above the 16.60 level yesterday, it now brings the Upper Trend Line of the triangle into play. This Trend Line is located just under the 18 level. I got a great question from Dave A. yesterday asking why the Model is still not getting aggressive with crude. The answer is that until UCO breaks out of the triangle, it’s still possible that it could make one more down move within the triangle. A move above the 18 + level would confirm the breakout. This is where I will start to get serious with crude.
There were NO CHANGES to the Model after yesterday’s session. The Model continues to hold a ‘trial’ position of 1,000 shares in UCO and $110,575 in cash. After yesterday’s session, the Model is up 27.7 percent since it started on 26 February.
The Model Portfolio is being shown for educational purposed only. The Buy/Sell actions in the Model Portfolio are made based on technical indicators that can and do change frequently and should NOT be considered as recommendations for trading an actual portfolio. Any gain or loss in the Model Portfolio should not be used to predict future performance of the Model.
That’s what I’m doing,
h
Market Signals for
10-24-2019
| DMI (DIA) | POS |
| DMI (QQQ) | POS |
| A/D OSC | |
| DEANs LIST | NEU |
| THE TIDE | POS |
| Index | Signal | Signal Date |
|---|---|---|
| DOW | NEU | 22 Oct 2019 |
| NASDAQ | NEU | 22 Oct 2019 |
| GOLD | NEU | 23 Oct 2019 |
| U.S. DOLLAR | NEU | 22 Oct 2019 |
| BONDS | NEU | 23 Oct 2019 |
| CRUDE OIL | POS | 23 Oct 2019 |

Category: Professor's Comments