
Professor’s Comments January 25, 2016
Posted by OMS at January 25th, 2016
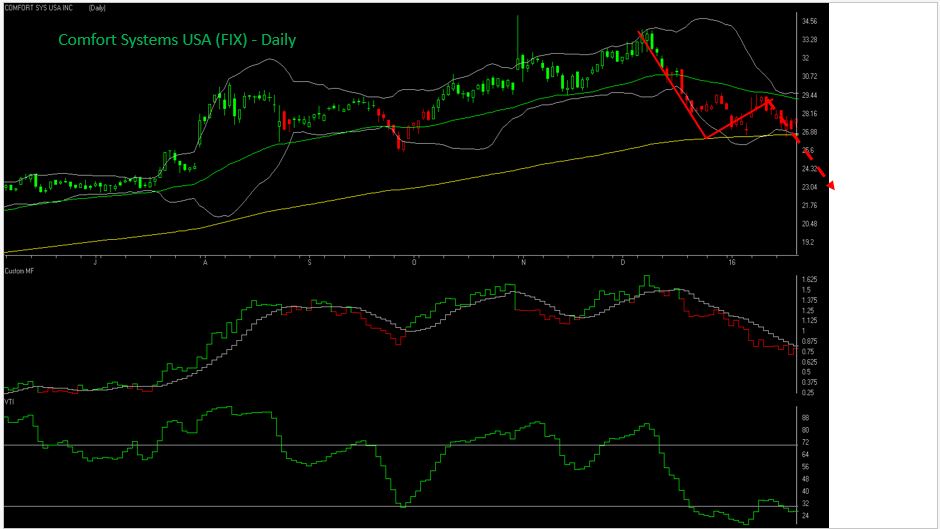
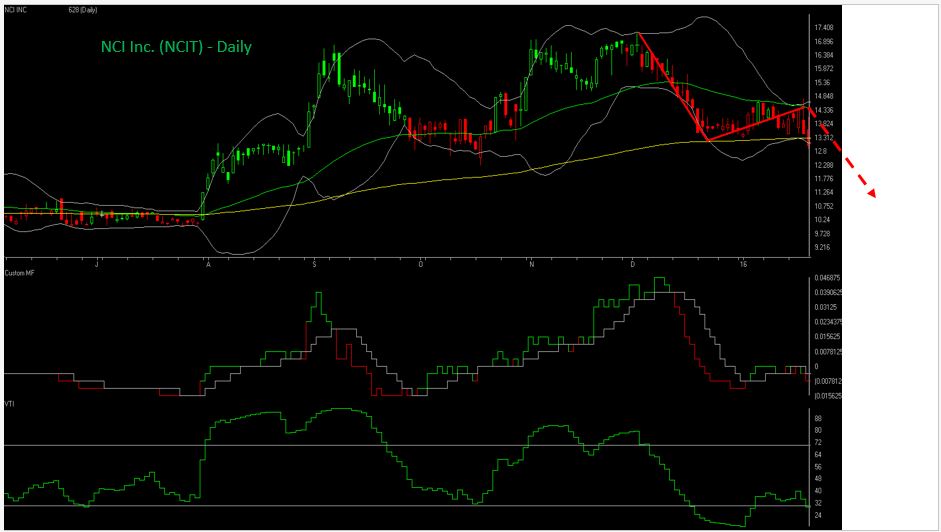
Attached are two stocks, NCIT and FIX, that the Emeritus algorithm highlighted as shorts this past weekend. What’s unusual about these two stocks is they were NOT highlighted from the Member’s Watch List data base. They were generated from list of 1500 stocks using weekly data.
The reason I used the S&P1500 and weekly data was to provide students with more stocks to choose from than can be generated from the much smaller data base of the Member’s Watch List.
Also by using weekly data, the highlighted stocks tend to be of longer duration than those produced with daily data.
I realize that most of my students either can’t or don’t want to scalp trade, and would prefer to position trade or trade using a longer term strategy. By running the algorithm on weekly data, it tended to produce trades of longer duration.
One of the things I also noticed with the larger data base was that the algorithm started to act like The Professor algorithm. In other words, the algorithm was very good at identify major trends.
For example, when the Dean’s List and Tide turned negative in the first days of January, the algorithm identified 135 stocks as shorts. Think about this for a moment. It meant that 135 stocks in a data base of 1500 stocks were trending to the south side. That’s a lot of stocks! It resulted in the Dow falling over 1,000 points. It confirmed what The Professor algorithm was saying about a new trend starting..
Then on 15 January, the algorithm identified 25 additional stocks as shorts. Some of these in alphabetical order, straight from the list without any screening for Money Flow, are AMT, BABY, CAB, CAH, CAM, CAB, CB, CCI, CRPT, CUB, ELY, FICO, GFF, HMSY, KLIC….and others to make up the 25. You might want to look at a few to see how they performed as of Friday.
BTW, the algorithm did not identify any longs during this period. This alone should tell you something about the overall health of the market. Compare this to the 75 stocks that were generated as longs on 9 October, just before the Dow rallied for almost 1,000 Dow points.
Anyhow, even though I’m still evaluating the algorithm on this expanded data base, I thought would share some of this with you so you can see how some of these stocks perform during the next few weeks.
If they continue to perform well, I will likely start to adding them to the Honor Roll, only identifying them as weekly selections.
Then longer term traders can use the Honor Roll the same way it’s used by shorter term traders. They can simply watch for the Tide or the Summation Index to change direction and then choose either daily or weekly stocks to trade. This should help students pick stocks that fit their particular style of trading.
That’s what I’m doing,
h
Not sure of the terminology we use? Check out these articles
The Hockey Stick Pattern
The Creation of Waves and Trends
FAQ
All of the commentary expressed in this site and any attachments are opinions of the author, subject to change, and provided for educational purposes only. Nothing in this commentary or any attachments should be considered as trading advice. Trading any financial instrument is RISKY and may result in loss of capital including loss of principal. Past performance is not indicative of future results. Always understand the RISK before you trade.

Category: Professor's Comments