Professor’s Comments February 10, 2016
Posted by OMS at February 10th, 2016
The Dow fell 13 points, closing at 16,014. Volume was moderate, coming in at 104 percent of its 10-day average. There were 69 new highs and 438 new lows.
Not much changed after yesterday’s trading action. It still appears that Monday’s bounce off 15,804 was wave ‘b’ in an a-b-c sequence for Major Wave 2 up. If this is the case, the market should continue its wave ‘c’ rally today which should take the Dow back to the 17,000 level.
As long as the Money Flow indicators remain positive, I have to go with this scenario. However, if these indicators turn negative and join The Tide and the Dean’s List, I will have to say that Major Wave 3 down has started.
Last night, there were no Daily additions to the Honor Roll. This also argues for the market being in some type of corrective pattern. One thing I did note was that Emeritus has started to generate a few Weekly shorts. These are longer term trades that come from a data base using the S&P1500. The fact that these trades are now starting to appear tells me that once the current rally completes, the next major wave will be down. However, the current pattern suggests that the decline will start from a level closer to 17,000.
Last night’s early futures were down almost 100 points But once the election returns from New Hampshire started to come in, they started to turn around. I would not be surprised to see the markets continue their upward move today as investors consider the possibility of real change in Washington’s anti-business policies. Like Andy Dufresne said to Red, “Hope is a good thing, maybe the best of things, and no good thing ever dies.”
During the next month or so, I believe that ‘Hope’ will continue to influence stock prices in a positive manor. As the primary campaigns move south, the pattern still suggests that the markets will move north. The Money Flow indicators are just too strong now for a down trend to begin.
BTW, gold fell yesterday causing GDX to form a Bearish Enveloping Pattern the day after a Hanging Man pattern appeared. This supports my belief that gold stocks have formed a temporary wave 1 top and will now start to pull back to the 200 day moving averages.
With a negative Money Flow indicator on GDX, all I’m doing now is being patient and waiting for the ‘Blade’ to form.
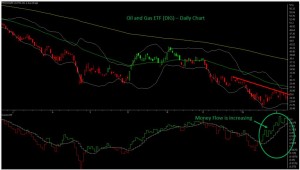
In yesterday’s 11.05 Update, I talked about DIG, the positive Oil and Gas ETF.
Here’s a Daily Chart that shows the positive divergence that caught my attention and caused me to talk about it.
h
Market Signals for
02-10-2016
| DMI (DIA) | NEG |
| DMI (QQQ) | NEG |
| COACH (DIA) | POS |
| COACH (QQQ) | POS |
| A/D OSC | |
| DEANs LIST | NEG |
| THE TIDE | NEG |
| SUM IND | NEG |
Not sure of the terminology we use? Check out these articles
The Hockey Stick Pattern
The Creation of Waves and Trends
FAQ
All of the commentary expressed in this site and any attachments are opinions of the author, subject to change, and provided for educational purposes only. Nothing in this commentary or any attachments should be considered as trading advice. Trading any financial instrument is RISKY and may result in loss of capital including loss of principal. Past performance is not indicative of future results. Always understand the RISK before you trade.

Category: Professor's Comments

