
Professor’s Comments December 23, 2014
Posted by OMS at December 23rd, 2014
I’m in Dallas this week at my son’s house for Christmas, so I’m an hour behind the time on the east coast. Hopefully this one hour difference won’t impact your ability to read and digest my comments.
Not much changed yesterday even with the Dow rising another 153 points to close at 17,959. The rally did NOT exceed the 5 December High of 17,991, so the wave 2 retracement rally scenario remains intact.
Same for the SPX which gained 7.8 points to close at 2078.54. It’s still below its 5 December of 2079.46.
The NASDAQ (QQQ) only rose 0.25 points to close at 104.58. It didn’t even exceed Friday’s high of 104.74. The high for the QQQ occurred on 28 November at 106.2., Right now, the NASDAQ appears to be the weakest index.
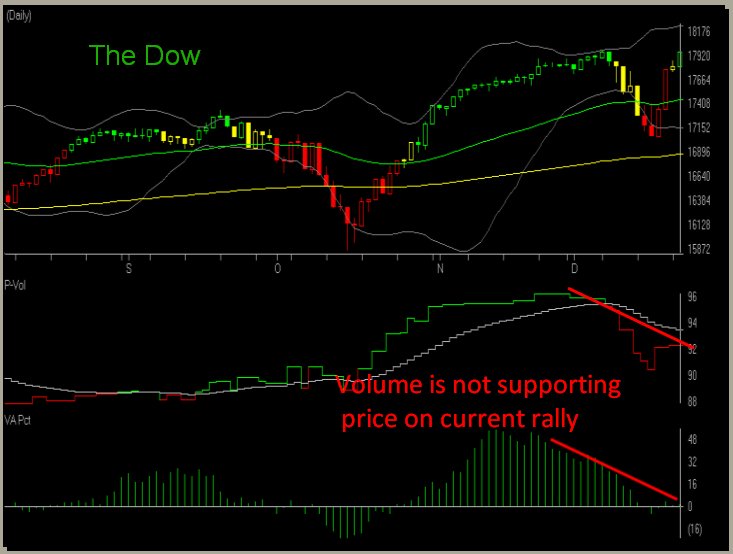
So even though there were large gains in the Dow, the other indexes did not fare as well and are now showing significant divergences. Also, as the Dow is approaching new highs, the P-volume is still very negative. Same for the P-volume on the NASDAQ (QQQ). At the end of the day, while prices can continue to rise over the short term, the fact that the P-volume is not keeping pace is a warning. It’s usually the better tell.
Also, all of the breadth indicators that make up The Tide are showing significant divergences, as is the Volume Accumulation Percentage. I’m attaching a chart with today’s comments that shows this divergence.
So while the rally continues, it’s been mostly in the Dow’s 30 large cap stocks. If you owned anything but Dow stocks for the past few days, odds are that you did not see your stocks advance a whole lot. And once the end-of-year Bullish bias starts to ebb, it likely the market will be on some very shaky ground.
The Dean’s List and Tide remain positive, but the PT indicators are mixed. So with mixed signals, diverging breadth and volume indicators, and a pattern that appears close to topping, we need to be on the lookout for a Tide reversal.
At this point, I believe the upside is limited to a few hundred Dow points. On the other hand, the downside risk is starting to appear significant. I do not believe this is a good time to be buying stocks.
The fact that the Dow gained over 150 points on a day when the other indexes performed weakly is a major concern. The generals in the Dow are saying charge, but the troops are NOT listening. When this starts to happen, its usually a sign that a major top is approaching. Be very careful now.
That’s what I’m doing,
h
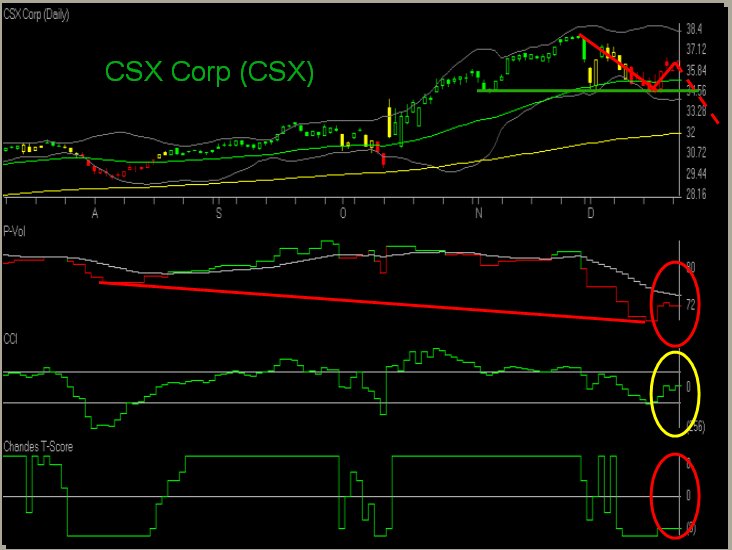
I’m including a chart of CSX Corporation for all my Jacksonville readers this morning. CSX is home based in Jacksonville and many of my students own the stock. I want to talk about it today, because after yesterday’s 150 point rally in the Dow, I believe it is a better representation of what’s going on in the overall market now.
As you can see from the CCI and Chandes T-Score, there is NO trend in place. If anything, the T-score is still showing that the major trend is still down.
But look at the P-volume. It’s at levels now that it hasn’t seen in over two years. Clearly the volume has not kept pace with the rising price.
And now a small negative Hockey Stick pattern has formed. If the momentum starts to turn negative, CSX could fall several points and test the 32 level. If it falls below 32, it will ‘Jump the Ropes’ to the downside, which would signal that a major down trend could be starting.
Because of this, I would watch the 34.34 level very closely. If 34.34 is broken, the next move will likely be below the moving average of 31.94.
Also, the stock completed a THT pattern in late November, and now the PT indicators are negative. In the Professor’s Methodology, we look to short stocks when this happens. The target based on the interim low between the first two highs is just under 30.
Now while a decline to 30 might not seem so bad on the surface, those 8 points represent a potential 20 percent drop. But the really bad thing about it is that IF the decline happens now, it will likely start to move the stock into a down trend. And the start of a downtrend after a 20 percent loss is something to be concerned about.
CSX is the kind of stock that scares me going into next year once the positive year-end Bullish bias ends. There are a lot of stocks that look just like CSX now.
You might want to look at your stocks to see if they have a pattern similar to the one on CSX.
That’s what I’m doing,
h
| Market Signals for 12-23-2014 |
|
|---|---|
| DMI (DIA) | POS |
| DMI (QQQ) | NEG |
| COACH (DIA) | POS |
| COACH (QQQ) | POS |
| A/D OSC | |
| DEANs LIST | POS |
| THE TIDE | POS |
Not sure of the terminology we use? Check out these articles
The Hockey Stick Pattern
The Creation of Waves and Trends
FAQ
All of the commentary expressed in this site and any attachments are opinions of the author, subject to change, and provided for educational purposes only. Nothing in this commentary or any attachments should be considered as trading advice. Trading any financial instrument is RISKY and may result in loss of capital including loss of principal. Past performance is not indicative of future results. Always understand the RISK before you trade.

Category: Professor's Comments