
Weekend Strategy Review May 28, 2017
Posted by OMS at May 28th, 2017
The Dow fell 3 points on Friday, closing at 21,080. It was up 275 points for the week. The NASDAQ finished up 5 points on Friday and up 127 points for the week.
There was another small change in the A-D oscillator on Friday, this time the change was only 6.7 points. Back to back small change signals usually lead to an outsized move in the Dow within the next 1-2 days. Students should be prepared for a Big move early next week.
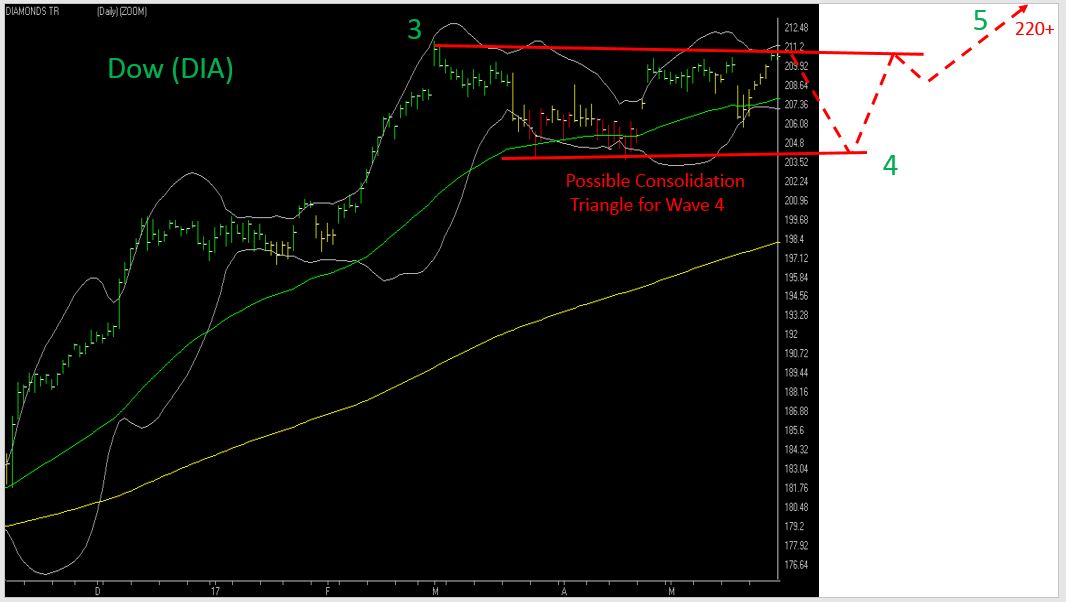
With the Dow and SPX overbought and trading near the Upper Trend Lines of their triangle patterns, the Big Move could be down. The fact that both indexes are trading near their Upper Bollinger Bands also suggests a pullback is likely.
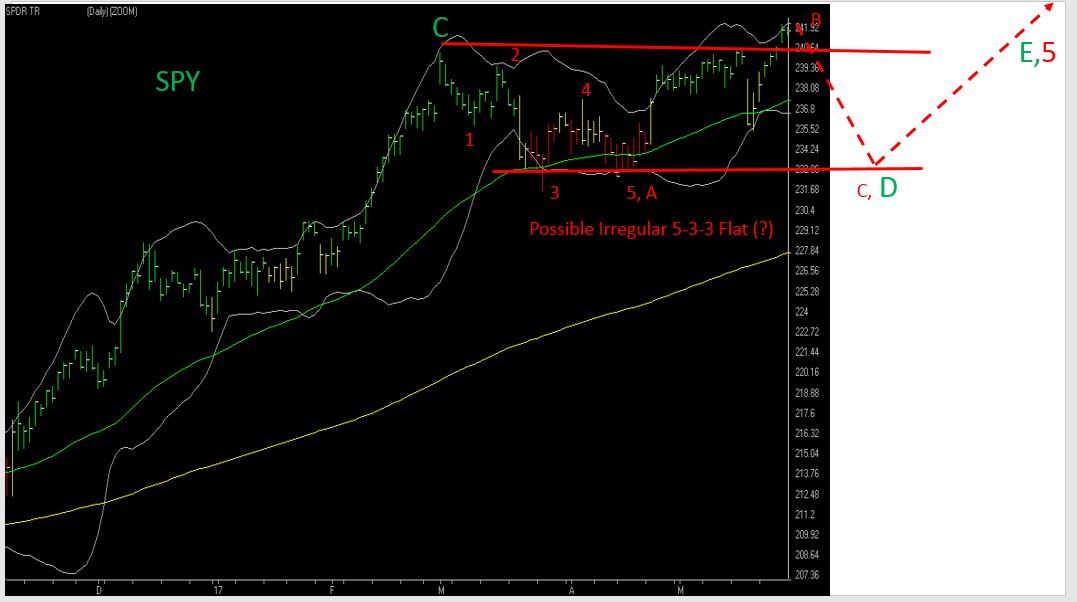
On Friday I mentioned that I would update the charts of the Dow and SPX to show the slightly different triangle patterns that are developing. If you go back and look at the chart of the SPY I first presented on 29 April, it showed a symmetrical triangle pattern. The pattern hasn’t changed a whole lot since then.
As the new charts suggest, the Dow remains in a sideways triangle, range bound between 21,150 on the upside and 20,500 on the down. But now, the SPX appears to be forming an irregular flat pattern. An irregular flat is like a sideways triangle, but one of its sub-waves wave exceeds the upper trend line of the sideways triangle. If this is the case, the SPX should begin its next wave down very soon. This decline would be sub-wave ‘c’ down of Wave ‘D’ down and could end in mid-June. This wave could drop the SPX to the 2,320 level before it completes. The decline would be about 100 S&P points from current levels.
Friday’s Sector Report continued to show 9 strong and 15 weak sectors. The Semis, Computers, Leisure, Food, and Utility Sectors continue to show strength with Autos, Specialty Banks, Real Estate, Energy, Retail, and Telecoms lagging. If the weak Sectors remain in the majority, it’s likely the triangle patterns on the Dow and SPX will continue to develop.
GLD rose 1.06 cents to 120.54 on Friday. The rise could be the break out from the ‘Blade’ that has been developing near the moving averages for the past seven trading sessions. If the breakout is occurring, GLD and other mining stocks and ETFs should start to move higher. The VTI on GLD continues to move up and now shows a reading of 60.57. GLD should start to trend if the VTI moves above 70.
The markets will be closed Monday for the Memorial Day Holiday. Have a great holiday weekend.
That’s what I’m doing,
h
Market Signals for
05-30-2017
| DMI (DIA) | POS |
| DMI (QQQ) | POS |
| COACH (DIA) | POS |
| COACH (QQQ) | POS |
| A/D OSC | SM CHG |
| DEANs LIST | POS |
| THE TIDE | POS |
| SUM IND | POS |
| VTI | POS |
Only getting the Professor’s Weekend Review? Try his daily update Cum Laude service for 2 weeks only $9.99 LEARN MORE
All of the commentary expressed in this site and any attachments are opinions of the author, subject to change, and provided for educational purposes only. Nothing in this commentary or any attachments should be considered as trading advice. Trading any financial instrument is RISKY and may result in loss of capital including loss of principal. Past performance is not indicative of future results. Always understand the RISK before you trade.

Category: Professor's Comments, Weekend Strategy Review