
Professor’s Comments December 30, 2014
Posted by OMS at December 30th, 2014
The Dow fell 15 points, closing at 18,038. The post-holiday trading volume was low, coming in at 68 percent of its 10 day average. There were 253 new highs and only 37 new lows.
Not much changed yesterday as the market continued to trade in a very narrow range. This caused the A-D oscillator to post a small change of 4.26 points which means that we need to be on the lookout for a Big Move within the next 1-2 days.
The Bearish divergences in P-volume, Volume Accumulation Percentage, and Money Flow continue. Yesterday’s small decline also caused the On-Balance Volume indicator to turn negative as well. So even though the Dow made new highs last week, it is doing it on less and less volume. This tells me that the market is in very shaky ground.
On the other hand, the Dean’s List, The Tide, and all of the cockpit indicators are positive. And as long as these indicators remain positive, the odds favor higher prices.
During the weekend, I spent a lot of time looking at my charts, trying to come up with a scenario for where the current rally will top. For now, the most likely scenario for the Dow, given the large divergences I’m seeing in volume, is somewhere between current levels and 18,350. The same scenario for the SPX is slightly above the 2100 level. Both of these scenarios assume that the rally since the 15 October low is unfolding as an a-b-c pattern, with wave ‘a’ up completing on 5 December, and ‘b’ down finishing on 16 December. If this is in fact what is occurring, then wave ‘c’ up should complete after the start of the new year.
However there is another very Bullish scenario that needs to be watched. This scenario says that the rally since the 15 October low will develop in 5 waves, not three. If this were to occur, then the current rally leg would have to be labeled wave 3 up, which means that once complete, would be followed by a wave 4 down and finally a wave 5 up. This scenario could take the Dow above 19,000 before all 5 waves complete.
At this point I have to give this second scenario a very low probability because of the divergences I’m seeing in volume and money flow. However, IF the volume starts to pick up and money starts to flow into the market after year’s end, then the odds will increase for this scenario. Right now this is NOT happening. Also, as long as the Dean’s List and The Tide remain positive, we need to be aware of this scenario.
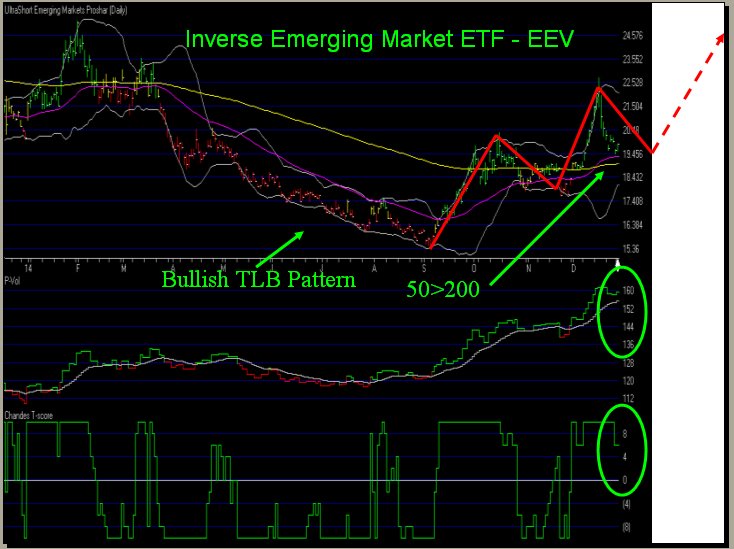
Last night’s Dean’s List was not very strong. The three top ETFs on the List were related to bonds, inverse oil, and utilities. If you look beyond these three ETFs with RS rankings of 3, all the rest of the ETFs on the List are rated 2, 1 or zero. One of the ETFs rated 2 is EEV, the inverse Emerging Market ETF. As long as DUG, the inverse oil ETF remains on the List, odds are that EEV will remain there too. This tells me that the problems with the Russian economy and other economies based on oil revenue, like Brazil, Venezuela and Iran, will continue. A few weeks ago, I talked about the effects of oil under 60 bucks and how this will wreck their economies. As long as oil remains low, I find EEV to be very attractive, especially now that it has pulled back from its HS target of 22 and is now trading under 20 bucks. Remember, EEV is now in an Uptrend with the 50 above the 200. The P-volume is also showing positive divergence during the pullback. These are things we look for in stocks that are in the process of forming turn around patterns.
So, with DUG as my oil “Stick in the Sand’, I’m looking for the next move in EEV to challenge the 24.5 level, based on the recent 5 point ‘Stick and Blade’ pattern. As long as the PT indicators remain green, I will be looking to accumulate shares.
That’s what I’m doing,
h
| Market Signals for 12-30-2014 |
|
|---|---|
| DMI (DIA) | POS |
| DMI (QQQ) | POS |
| COACH (DIA) | POS |
| COACH (QQQ) | POS |
| A/D OSC | SM CHG |
| DEANs LIST | POS |
| THE TIDE | POS |
Not sure of the terminology we use? Check out these articles
The Hockey Stick Pattern
The Creation of Waves and Trends
FAQ
All of the commentary expressed in this site and any attachments are opinions of the author, subject to change, and provided for educational purposes only. Nothing in this commentary or any attachments should be considered as trading advice. Trading any financial instrument is RISKY and may result in loss of capital including loss of principal. Past performance is not indicative of future results. Always understand the RISK before you trade.

Category: Professor's Comments