
Professor’s Comments December 24, 2014
Posted by OMS at December 26th, 2014
The Dow gained 65 points yesterday, reaching a new high above 18,000. The NASDAQ finished unchanged. So once again we see a handful of larger cap stocks pushing the major index higher without the troops following. This is just another negative divergence in a market that is full of negative divergences. It makes me wonder how long this rally will continue before prices start to fall hard?
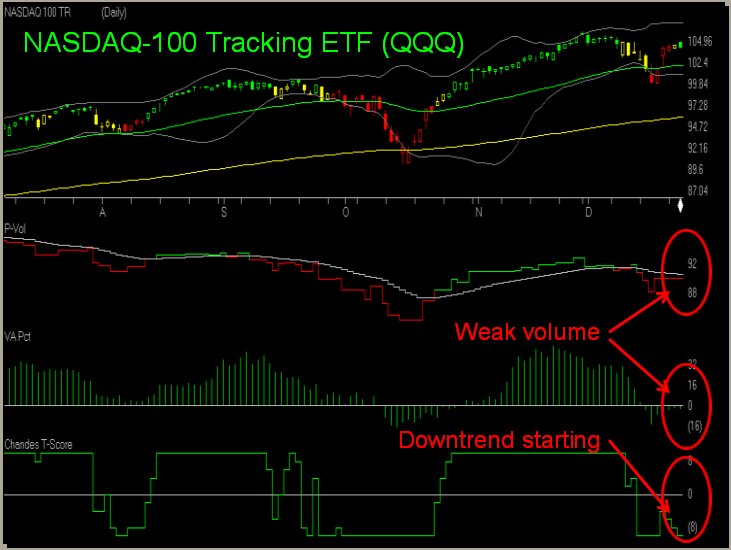
Yesterday I posted a chart that showed the divergences that have been building in P-volume and the Volume Accumulation Percent for the Dow based on NYSE data. Today I want to show you a similar chart for the NASDAQ-100 tracking ETF, QQQ. Notice on the first chart that while the QQQ has been rising for the past few days, it too has been rising on extremely weak volume. This is something you do not want to see if you’re Bullish.
Same for the Dow. Yesterday’s volume was the lowest in the last 17 trading sessions. It was only about 60 percent of the volume that we saw last week when the Dow was falling and making interim lows. So what does this mean?
Well, when the market falls on heavy volume, it tells me that a lot of traders and institutions wanted out. They got scared. They couldn’t get rid of their stock fast enough. But after the market completed a five wave decline, a handful of traders stepped up to the plate and started to buy. Then once the rally started, it was fueled by other traders as they covered their short positions. You can see this in the low total volume, P-volume and Volume Accumulation Percentages. In other words, it was NOT a healthy rally.
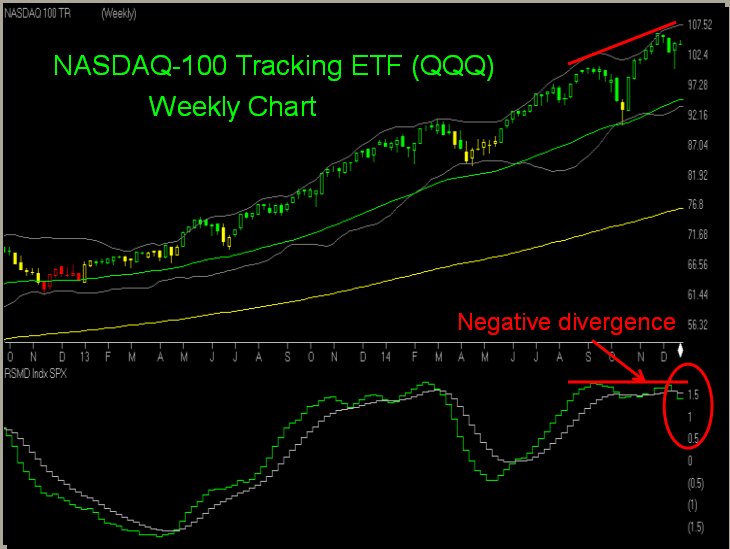
In a healthy rally, the buying comes from both the institutions and the retail investors. When both of these groups participate, the added volume usually leads to a strong rally. We can see this by using an indicator that measures the Relative Strength of the NASDAQ compared to the SPX
At the start of a Bullish phase, the small retail investor starts to feel confident and buys small cap stocks. This added volume helps push the market higher. On the other hand, when a Bullish phase nears completion, these same investors start to sell the small caps which weakens the NASDAQ.
This relationship can be seen in the second chart in the package which is a weekly chart of the NASDAQ tracking ETF (QQQ). Notice how back in May 2013, the QQQ started to strengthen compared to the SPX. The retail investor was convinced that the market was going higher and started buying small cap stocks. This rally lasted until May 2014 when small investors started to pull money from the market causing the NASDAQ to become weaker than the SPX. Then in May-June 2014, the retail investor started to buy stocks again, pushing the market higher. This lasted until mid-September when he started to sell his stocks. This selling condition continued as money moved into the larger cap issues. And now, as the market continued to rise during the past two months, the Relative Strength of the NASDAQ has once again started to weaken compared to the SPX. The negative divergence is noticeable and significant.
In general it is usually a good time to be in the market when the NASDAQ is stronger than the SPX. This is no longer the case now. Now the NASDAQ is weaker than the SPX. In other words, this is NOT a good time to be buying stocks.
So all I’m doing now is waiting.
If I’m right, the market should start to roll over very soon. Then once The Tide turns negative, I’ll start looking for a few inverse ETFs to trade.
That’s what I’m doing,
h
The markets will be closing early today for the Christmas Holiday.
This will be my last Update until this weekend when I’ll post the WSR.
| Market Signals for 12-26-2014 |
|
|---|---|
| DMI (DIA) | POS |
| DMI (QQQ) | POS |
| COACH (DIA) | POS |
| COACH (QQQ) | POS |
| A/D OSC | |
| DEANs LIST | POS |
| THE TIDE | POS |
Not sure of the terminology we use? Check out these articles
The Hockey Stick Pattern
The Creation of Waves and Trends
FAQ
All of the commentary expressed in this site and any attachments are opinions of the author, subject to change, and provided for educational purposes only. Nothing in this commentary or any attachments should be considered as trading advice. Trading any financial instrument is RISKY and may result in loss of capital including loss of principal. Past performance is not indicative of future results. Always understand the RISK before you trade.

Category: Professor's Comments