Weekend Strategy Review February 16, 2014 Part 2
Posted by OMS at February 16th, 2014
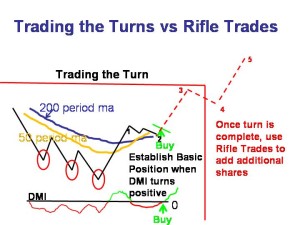
Because I had some extra time this morning, I wanted to take a few minutes to show some of the new students the two patterns that we use in The Professor’s Methodology and how they relate to some of the stocks I talk about.
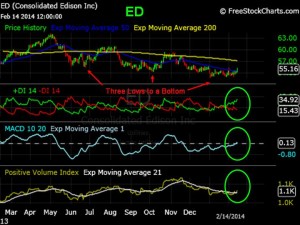
The first chart shows how we ‘Trade the Turns’. Con Edison, ED, a stock highlighted this weekend by Emeritus for the Honor Roll, is a good example of this pattern. And because its PT indicators turned Green on Friday, it’s now at a point where I would consider it as a ‘trade’.
A ‘trade’ means that I will be establishing a partial position in the stock and seeing if it can ‘Jump the Ropes’ again and in doing so, put the stock into an Uptrend. At this point, ED is still in a downtrend (50<200) so I can’t even think about buying a full Basic Position. But it can be considered as a trade as the PT indicators remain Green. ED also satisfied all of the elements of the SIGN. It’s on a List (MWL), has a pattern (TLB) and now has positive PT indicators.
I’m also including three other charts for your consideration this weekend.
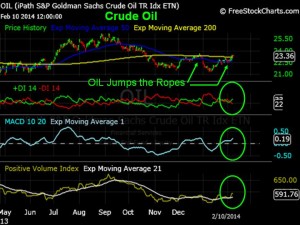
In my Update Class, I showed students a chart of Crude Oil. It too has a TLB pattern with Green PT indicators. So something could be going on with Crude Oil. Also, it’s mid February, and as you know you know I’m always interested in trading energy in the March-April time period.
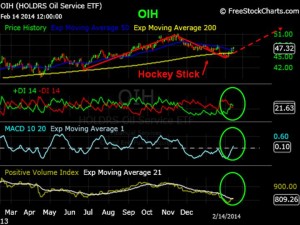
But energy is a big sector, so I need to narrow it down to determine where the best performers are likely going to be. And because I see OIH, the Oilfield Services ETF on the Dean’s List, I start to look for individual stocks from this Group on the Member’s Watch List.
There are several, including SLB, HAL, CJES and SPN. Usually when you see several stocks from the same Sector or Group on the MWL, it’s time to start paying attention. Just think back to how the gold and silver stocks started to appear on the Lists back in early January.
My favorite stock in the Oilfield Service Group is Schlumberger, SLB. I have talked a lot about SLB in my Comments during the past few months and the stock has done nicely. But SLB has gotten a bit ahead of itself recently off its small HS Pattern and may not be the Best Buy at the present time. I’d love to see it pull back a few points this week.
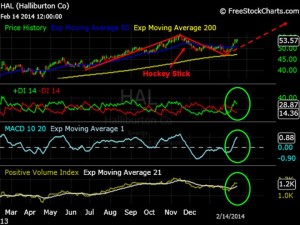
But the thing I want to call your attention to today is the Oilfield Service Group itself. And that’s why I have included a chart of OIH, the Oilfield Service ETF. As you can see from the chart, it has a beautiful Hockey Stick Pattern.
Same for Halliburton, HAL.
If the Dow is going to push higher toward 17,000 in the next few months, then I would expect stocks from the Energy Sector and the Oilfield Service Group to lead the way.
Have a great weekend.
That’s what I’m doing,
h
All of the commentary expressed in this site and any attachments are opinions of the author, subject to change, and provided for educational purposes only. Nothing in this commentary or any attachments should be considered as trading advice. Trading any financial instrument is RISKY and may result in loss of capital including loss of principal. Past performance is not indicative of future results. Always understand the RISK before you trade.

Category: Professor's Comments, Weekend Strategy Review

