
Professor’s Comments March 28, 2017
Posted by OMS at March 28th, 2017
The Dow fell 46 points, closing at 20,551. Volume was moderate, coming in at 93 percent of its 10-day average. There were 48 new highs and 41 new lows.
Yesterday’s large decline after the opening bell was the Big Move predicted by Friday’s small change in the A-D oscillator. At its worst level, the Dow was down 184 points, coming within 13 points of my target of 20,400. Everything appeared to be on track for additional decline except for one thing: The Professor Algorithm.
When I ran the algorithm just after the opening decline, he only had 1 short highlighted. Hmmm?
Remember, the DMI on the Dow turned negative last Tuesday, 21 March. And whenever the DMI turns, I run the Professor algorithm to see if he confirms the turn by highlighting a bunch of stocks, either short or long. He didn’t. Since last Tuesday, he has only highlighted 13, 4, 0, 3 and last night’s 1 short. If the market was going to experience a serious decline, there should be more than 40 shorts. It hasn’t happen.
So, something else must be going on. This is why I posted the 10am Update saying I was selling my shares of TWM, the inverse Russell 2K ETF, just after yesterday’s open. Yes, the Dow hit my target of 20,400, but something strange was happening.
What could it be?
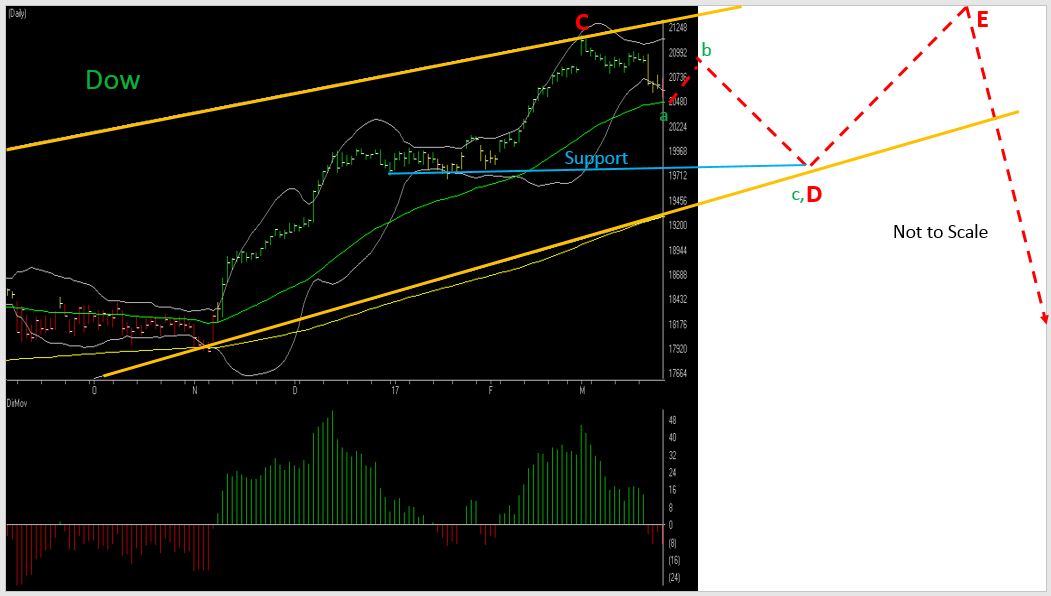
Up until yesterday, I was trading the market thinking the top was in. But after seeing the results of the Professor yesterday, this might not be the case. I’m now starting to think that the high of 21,169 made on 1 March was the Wave ‘C’ high, which means that we still have Wave ‘D’ down and final Wave ‘E’ up to go before the Major Ending Diagonal completes.
Yesterday’s low of 20,413 could have been wave ‘a’ down of Wave ‘D’ down. If this the case, the markets should rally for the next week or so for wave ‘b’ up, and then start another leg down reaching the 19,800 – 20,000 level by late April. After Wave ‘D’ down completes, the market should start its final Wave ‘E’ rally to a top sometime in late summer, probably near the end of August.
This is what The Professor told me yesterday by only highlighting one short. The lack of impulsive action (NOT seeing many shorts) means that the move down from the 1 March top is likely corrective, within a larger move up, and NOT the start of a Major move down.
Don’t get me wrong. Once the Dow rallies back to gain another 200-300 points in wave ‘b’ during the next week or so, the move down to the 19,800 – 20,000 level during wave ‘c’ will feel like a Major Move down. April could turn out to be a really bad month for the market. But right now it’s looking like the fall to support near 19,800 -20,000 should hold and a Wave ‘E’ summer rally should develop from that level.
During this rally, I would expect the Dollar to strengthen, and Bonds to weaken. So towards the end of April, look for UDN to drop off the Dean’s List and for UUP to appear. As equities decline during April, I would expect gold to rally, but with the Dollar close to support near 98, gold traders need to watch for signs of a Dollar rally that could take it to the 104-105 level. If this starts to happen, UDN could fall off the Dean’s List earlier than expected. As long as UDN stays on the Dean’s List, gold should be OK.
Yesterday’s Sector Report was little changed. The report had 17 strong sectors and 75 weak. The Semiconductors, Banks, Leisure, and Transportation continue to be the strongest of a weakening list. The Energy, Service, Retail and Media sectors are the weakest. There were no sectors with large changes in Delta Trend Scores.
So, given that we’re likely looking at a minor wave ‘b’ developing during the next week or so, I’m going to move to the sidelines and wait for higher prices before I start shorting again. With negative indicators on the cockpit, there is NO way I want to be long now.
I’m simply gonna wait for a wave ‘b’ rally and then place my bets (buy a few inverse index ETFs) for a move down to the 19,800 – 20,000 level. It should be a nice move down.
At last night’s Class I presented a chart of the Dow (attached) to show how the next few waves of pattern might unfold. The chart shows wave ‘b’ reaching a high near the 20, 900 level, but that might be a bit aggressive. If the Dow starts to move up beyond 20, 700, I’ll start shorting.
BTW, the right portion of the attached chart is not to scale. I ran out of room. After August-September, the move down should become extremely aggressive, reaching the 15,500 level where the Ending Diagonal began.
That’s what I’m doing,
h
Market Signals for
03-28-2017
| DMI (DIA) | NEG |
| DMI (QQQ) | NEG |
| COACH (DIA) | NEG |
| COACH (QQQ) | NEG |
| A/D OSC | |
| DEANs LIST | NEG |
| THE TIDE | NEG |
| SUM IND | NEG |
| VTI | NEG |
One hour video recorded from May 28, 2016 The Professor’s Signs of a Major Market Turn – Prospectives and the Projected Timing and Levels One hour streaming video – includes webinar handouts The Professor usually holds an update class whenever the Market looks like it may be making a major turn. If you have been following the Professor’s Comments you know that a turn is due….. LEARN MORE
Not sure of the terminology we use? Check out these articles
The Hockey Stick Pattern
The Creation of Waves and Trends
FAQ
All of the commentary expressed in this site and any attachments are opinions of the author, subject to change, and provided for educational purposes only. Nothing in this commentary or any attachments should be considered as trading advice. Trading any financial instrument is RISKY and may result in loss of capital including loss of principal. Past performance is not indicative of future results. Always understand the RISK before you trade.

Category: Professor's Comments