
Weekend Strategy Review November 2, 2014
Posted by OMS at November 2nd, 2014
Friday’s strong 194 point rally pretty much confirmed that the alternate wave ‘e’ up scenario is underway. By taking out the Dow’s high of 17,351 established on 19 September, it means that the Ending Diagonal Pattern for Major Wave 5 is not complete. It also means that the Dow could reach the 17,500 level, possibly even 18,000 before completing.
During the past two days, I received two similar emails from students asking about the current rally. They told me that they were continuing to hold short positions, and becoming concerned about where the wave 2 would end. Because of this, I thought it would be a good idea to review some of the things we do in the Professor’s Methodology this weekend, especially for the new students, to clarify what the methodology is all about.
First of all, unlike many other methodologies, we don’t base our trades on wave counts. As I have said many times, both in my Classes and on these pages, wave counts cannot be trusted. Wave counts based on Elliott Waves can and do morph into other wave counts. They can only be used as a guide. We use them to develop overall scenarios so that when they form patterns that match our other indicators, we have a general idea as to where the market could be heading.
However we NEVER base out trades on wave counts.
The Professor’s Methodology is based on Lists, Indicators and the Tide. When these three elements are in agreement, we trade the market in the direction of the indicators.
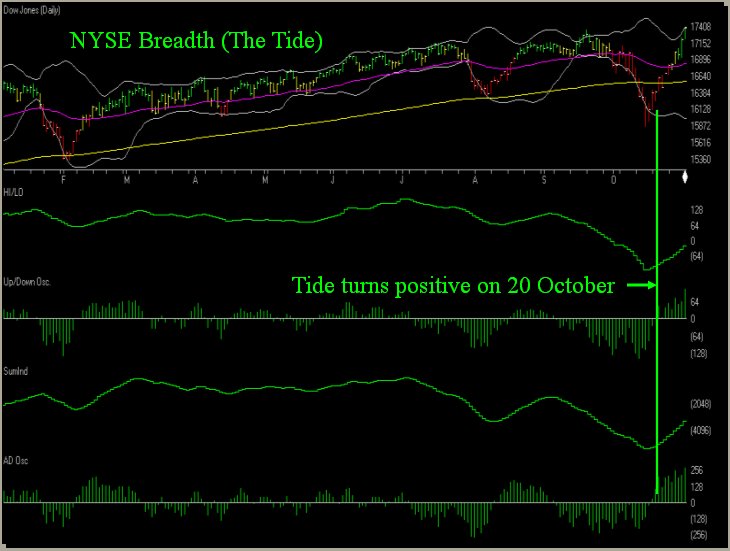
As I said many times, when the Tide changes, we never want to find ourselves holding positions that are going against the Tide. This is why we added a new indicator to the cockpit to tell students what the Tide is doing. Because the Tide is so important, I presented the information to local students at a special Update Class at UNF and did a webinar on 18 September so everyone could understand what the Tide was all about. If you still have not seen the webinar, you might want to order a copy from AIQ Systems.
By following the Dean’s List, Indicators, and the Tide, you will keep yourself on the right side of the market for most of the move. However because of the inherent lag in the indicators, there will always be times a particular wave count or pattern that we are working with starts to morph into something else. This is the nature of indicators and wave counts.
And this is what happened with the current pattern. It morphed several times.
At first it appeared to be a wave 4 within a 5 wave down sequence. Then when the market turned around, it looked like a normal wave 2 retracement of wave 1 down. When the retracement exceeded the limits for a wave 2, it was re-labeled as an ‘e’ wave. This happens all the time with wave counts and is why we MUST rely on other indicators.
For example, the attached breadth chart shows how the Tide turned positive on Monday, 20 October with the Dow trading at 16,400. This is when I turned the light on the cockpit from Yellow to Green. In my Comments on the Friday before, I mentioned that while Tide remained negative, the delta change was very small, suggesting that the market was approaching a short-term bottom. The following Monday, the breadth (Tide) did indeed turn positive which caused me to turn the cockpit breadth light Green. Again, this was when the Dow was at the 16,400 level. Now it’s at 17,390, and the Tide is still positive.
Bottom Line: In the Professor’s Methodology we only use patterns and wave counts as a guide. We base our trades on our Lists, Indicators and the Tide.
Money management is also a large part of the Professor’s Methodology. It tells us when to get aggressive and when to trade cautiously. Basically, we become aggressive when the market is trending, like in waves 1,3, and 5. When the market is appears to be completing a trend wave, and entering a retracement period, we pull in our horns and trade cautiously.
So on 1 October when the PT indicators on the Dow turned negative, I started to become mildly aggressive to the short side. I saw that the Dow had formed a THT Pattern, the indicators were negative and several inverse ETFs started to appear on the Dean’s List. All of the elements of the SIGN were in place to start shorting. The down wave took the Dow down to the 15,855 level, which was very close to my target of 15,800. It was time to take profits. I knew that the market does not fall straight down and a retracement wave was highly likely. I also knew that retracement waves are very difficult to trade, and this is why they should always be approached with caution. If we trade retracement waves, we always trade them with smaller positions and take profits quickly.
However once the Dow’s retracement wave reached the 16,400 level on 20 October, the Tide turned positive. This precluded me from establishing any new positions that were moving against the direction of the Tide. The only thing I could do at that point was to trade with the Tide or to monitor my existing short positions. Because at the time, I still believed that the market was in a wave 2 retracement, I held onto my short position in TWM, mostly because the PT indicators were still positive. But when the indicators on TWM turned negative on 28 October, it was clear that something else was going on. The indicators were saying it was time to exit the position.
So now, even with the Dow likely moving toward 17,500, the current wave pattern still appears to be corrective within a Major Ending Diagonal Pattern. Ending Diagonals are Termination Patterns. They are not a pattern associated with the start of a new Bull Market. So regardless of what is happening now, I cannot become aggressive on the long side.
If I decide to trade the upside and stay in harmony with the Dean’s List and Tide, I can only be with small positions. If I have a profit, I will take it and run. This is because the ‘e’ wave of an Ending Diagonal does not have to reach its target of 17,500 or higher.
The ‘e’ wave could have a ‘throw over’ rally that could take the Dow toward the 18,000 level. Or it can truncate and end before reaching 17,500. There is no way to tell. ‘E’ waves are extremely difficult to trade.
So in the days ahead, it will be very important to pay strict attention to the Dean’s List, PT indicators and Tide. If they start to turn negative, I will start to become aggressive again, just like I did back in September when it appeared that wave 1 down was starting.
If the Tide starts to turn negative, I’ll look for inverse ETFs on the Dean’s List with a pattern before buying. Then I’ll watch the PT indicators to trigger the buy.
But right now, I’m just being cautious and watching the market as it moves into the election. As I always say, you don’t have to be in the market all the time; just when the odds are in your favor. And with a market that could just as easily fall as rise from current levels, I’d rather be on the sidelines.
Have a great weekend.
That’s what I’m doing,
h
| Market Signals for 11-03-2014 |
|
|---|---|
| DMI (DIA) | POS |
| DMI (QQQ) | POS |
| COACH (DIA) | POS |
| COACH (QQQ) | POS |
| A/D OSC | |
| DEANs LIST | POS |
| BREADTH | POS |
All of the commentary expressed in this site and any attachments are opinions of the author, subject to change, and provided for educational purposes only. Nothing in this commentary or any attachments should be considered as trading advice. Trading any financial instrument is RISKY and may result in loss of capital including loss of principal. Past performance is not indicative of future results. Always understand the RISK before you trade.

Category: Professor's Comments, Weekend Strategy Review