
Weekend Strategy Review November 10, 2019
Posted by OMS at November 10th, 2019
The markets fell early on Friday on weak volume, but then rallied to close about where they started. The Dow finished with a gain of 6 points, closing at 27,681. It was up 334 points for the week. The NASDAQ rose 41 points on Friday and was up 89 points for the week.
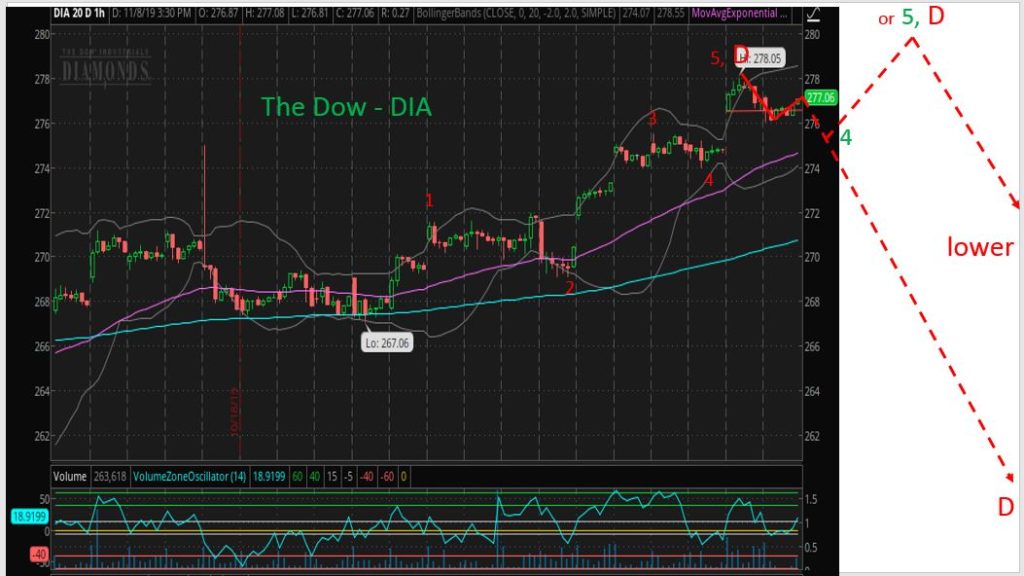
Friday’s early decline and late rebound appeared to form a small downward ‘Stick and Blade’ after Thursday’s high of 27,775. If Thursday’s high was the top, or interim top, one of two scenarios could be developing early next week.
The first scenario suggests the top is in. IF this is true, the Dow should begin a decline early next week that would eventually retrace the entire rally since the Ending Diagonal began in December 2018.
The second scenario suggests that Thursday’s top was only wave 3 of a five wave sequence for Wave D up. If this is the case, the Dow should decline to the 27,400-27,500 level for wave 4, and then rally to a new high just under the 28,000 level by late November. After Wave D up completes, the Dow should begin its Wave E decline back to the December low near 21,713.
In other words, both scenarios are longer term bearish. The only difference is whether the top is already in or will the Dow have one more rally before falling. We should begin to know by later this week.
There was a small change in the A-D oscillator on Friday, this time by less than a point. Because of this, we need to be on the lookout for a Big Move within the next 1-2 days.
BTW, the A-D oscillator joined the Hi-LO indicator and the Summation Index in negative territory on Friday, so now 3 of the 4 breadth indicators that make up The Tide are now negative. The only positive breadth indicator is now the Up-Down oscillator. If this indicator turns negative, it will increase the odds in favor of my first scenario.
The markets remain at a critical point in their patterns, showing negative divergences and sentiment readings that suggest they could begin to change direction in the days ahead.
There were no changes to the market timing indicators after Friday’s session. The Dow, SPX, NASDAQ, and Russell 2K remain on Buy Signals.
The Dean’s List remains Positive. The Tide is Neutral.
The Sector Ratio stayed at 21-3 Positive after Wednesday’s session. The Strongest Sectors were Service, Retail, Technology, Autos, and Banks. The three Weak Sectors were Household Products, Food and Telecoms. Students should watch the Sector Ratio next week. IF it begins to weaken and turns negative, it will confirm that the large decline I expect during the next few months is underway. Otherwise, IF it stays positive after a decline to near the 27,500 level, it would suggest that the decline is only wave 4 down with wave 5 up required to complete Wave D up.
Gold (GLD) fell 0.88 cents to 137.39. Gold has moved to a Sell Signal as it continues to consolidate within its Wave 4 triangle. If this triangle scenario is correct, GLD should be close to a bottom. If the indicators turn positive this week, the Model will re-purchase its gold shares as the large triangle pattern suggests higher prices.
One thing working against gold now is the strong Dollar. The recent rally in the Dollar has an a-b-c shape, typical of a wave 2. Friday’s rally carried the Dollar to its Upper Bollinger Band, so the rally should be close to complete. If this is the case, wave 3 down on the Dollar could begin next week, which should drive gold prices significantly higher. We’ll see.
Bonds (TMF) remain on a Sell Signal in a pattern that suggests Wave 3 down is starting. TMF fell 0.33 cents on Friday to close at 25.68. The Bond ETF is currently sitting on its 200 day moving average which is major support. If the equity markets decline this week, I would expect Bonds to rally off this support before falling again to re-test the 200. At this point, Bonds are EXTREMELY oversold, so some type of short-term bounce is likely. I want to see the strength of the bounce before looking for an entry point to re-purchase shares of TBT for the Model. As a minimum., I’d like to see TBT back at the 25.5 level.
UCO (crude oil ETF) rose 0.31 cents on Friday at 18.18. Friday’s early decline successfully re-tested the Upper Trend Line of its triangle near the 17.07 level. As long as UCO continues to trade near or above the 18 level during the next few days, it would be a good sign that the ETF is preparing for a move to its target near the 27-28 level.
BTW, Energy is now in the #6 position on the Strong Sector List. If UCO begins to break out of its triangle, Energy should move closer to the top of the Strong Sector List.
The Model sold its shares of GDX and NUGT on Friday. The Model continues to hold 1,500 shares of UCO, 800 shares of DXD and has $82,270 in cash. The Model plans to use its cash to buy additional shares of inverse index ETFs once the timing signals on the equity indexes turn negative. The Model is up 28.7 percent after Friday’s session.
BTW, just as an aside…the past few weeks have been EXTREMELY tough for a trader as the markets work to complete their patterns. Hopefully, the markets will begin a new trend phase soon which will make trading a lot easier in the months ahead. I wanted to mention this because new traders should realize that what we’ve seen during the past 2 months has been a difficult time for any trader…. even for those who have had many years of experience. Calling a Major top is always difficult, but never-the-less, the signs of a top are present. Whether the top is in or is closer to the 28,000 level doesn’t matter. What matters is that a top of major significance is fast approaching. Please understand that the end of the Bull Market from March 2009 is either at hand or nearly complete. At best, I believe we are only about 200-300 points from a major top…if the top is not already in. So this weekend’s message to my students is: Protect yourself!
The Model Portfolio is being shown for educational purposed only. The Buy/Sell actions in the Model Portfolio are made based on technical indicators that can and do change frequently and should NOT be considered as recommendations for trading an actual portfolio. Any gain or loss in the Model Portfolio should not be used to predict future performance of the Model.
That’s what I’m doing,
h
Market Signals for
11-11-2019
| DMI (DIA) | POS |
| DMI (QQQ) | POS |
| A/D OSC | SM CHG |
| DEANs LIST | POS |
| THE TIDE | NEU |
| Index | Signal | Signal Date |
|---|---|---|
| DOW | POS | 25 Oct 2019 |
| NASDAQ | POS | 24 Oct 2019 |
| GOLD | NEG | 08 Nov 2019 |
| U.S. DOLLAR | POS | 08 Nov 2019 |
| BONDS | NEG | 04 Nov 2019 |
| CRUDE OIL | POS | 01 Nov 2019 |
DISCLAIMER
As always, the Professor never makes recommendations. The information is provided on an educational basis so you can have informed discussions with your financial advisors and/or accountants about your individual investment decisions.
All of the commentary expressed in this site and any attachments are opinions of the author, subject to change, and provided for educational purposes only. Nothing in this commentary or any attachments should be considered as trading advice. Trading any financial instrument is RISKY and may result in loss of capital including loss of principal. Past performance is not indicative of future results. Always understand the RISK before you trade.

Category: Professor's Comments, Weekend Strategy Review