
Weekend Strategy Review May 5, 2019
Posted by OMS at May 5th, 2019
“Sell in May and go away” is a well-known financial-world adage, based on the historical underperformance of some stocks in the six-month period commencing in May and ending in October. The phase has its roots in England where wealthy London aristocrats would leave the city and escape to the country during the hot summer months. These aristocrats would usually return to London after the St. Leger’s Day Stakes, a thoroughbred horse race held in mid-September. The event was the last leg of the British Triple Crown.
In the early 20’s, a similar type of situation existed here in the U.S where wealthy Wall Street bankers and traders escaped to the Hamptons for the summer. Volume slowed to a crawl and prices tended to have a tough time being supported without volume.
But that was when traders had to be on the floor to make trades. Back then, they didn’t have computers. Now they do, and trades can be made from anywhere in the world, as long as there is an internet connection. So, does the adage still work? Hmm?
Well, if we look at the data, from 1950 to 2013, the Dow posted lower returns during the May to October period, compared with the November to April period.
In 2017, analysts at Bank of America Merrill Lynch did another study and looked at data for a three-month period going all the way back to 1928 and found that historically, June through August was the second best period of the year for stock market gains. So, whether you look at a 3 month vs. 6 month ‘summer’ period makes a Big Difference!
This has been especially true since 2013, where the data shows that those who blindly follow the Sell in May strategy might be missing out on some significant stock market gains.
This is why we need to follow the indicators and NOT some adage that doesn’t appear to make sense anymore.
So, after Friday’s strong rally, what are the indicators saying?
Well, before we look at the indicators, let’s examine what happened going into Friday’s session. The Dow appeared to be in the process of completing an a-b-c corrective pattern. Simple a-b-c patterns usually develop as Wave 2s within a larger move. This is the primary reason I exited the ‘trial’ position in TZA on Thursday. There was a strong possibility that Wave 2 down was nearing completion and the next wave would be a Wave 3 up. And that’s apparently what happened. Friday’s 200 point rally sure looked like the start of an impulsive Wave 3 up. And IF this is the case, the markets should continue to push higher at least into mid-May.
This is the Bullish case. However, things are not that simple. I’m still seeing negative Bearish divergences between breadth and index prices. Friday’s rally only turned two of the breadth indicators positive, so The Tide is still neutral. The Dean’s List remains positive.
Yesterday’s rally caused the market timing indicators for the NASDAQ to turn positive again. However, the Dow, SPX, and Russell 2K remain on a Neutral Signal.
So even though the market staged a strong rally that appears to be the start of Wave 3 up within the Ending Diagonal, this is NOT the time to be getting too aggressive. The Ending Diagonal Pattern has a target near the 27,000 level, however as its name implies, it DOES NOT have to reach 27,000. It can truncate at any time.
And with several major Fibonacci cluster dates scheduled for the next 12 days, the possibility that the Ending Diagonal Pattern will truncate remains high.
The other thing that concerns me now is the Sector Ratio. After Friday’s strong rally, the Ratio only gained one Sector making it 14-10 positive. If the market is getting ready to go on a tear to 27,000+, it will likely need a few more sectors participating. A ratio of 14-10, which is barely positive, probably won’t get it done.
The Strong List was led by Real Estate, Semiconductors, Insurance, Financials, and Leisure. The Weak Sector List was led by Service, Energy, Healthcare, PharmaBio and Telecoms. There are still 10 sectors on the Strong List with RS ratings of 1 or zero. So many of the Sectors on the Strong List remain in danger of falling off the List on a strong down day. My take: The Strong List is not that strong.
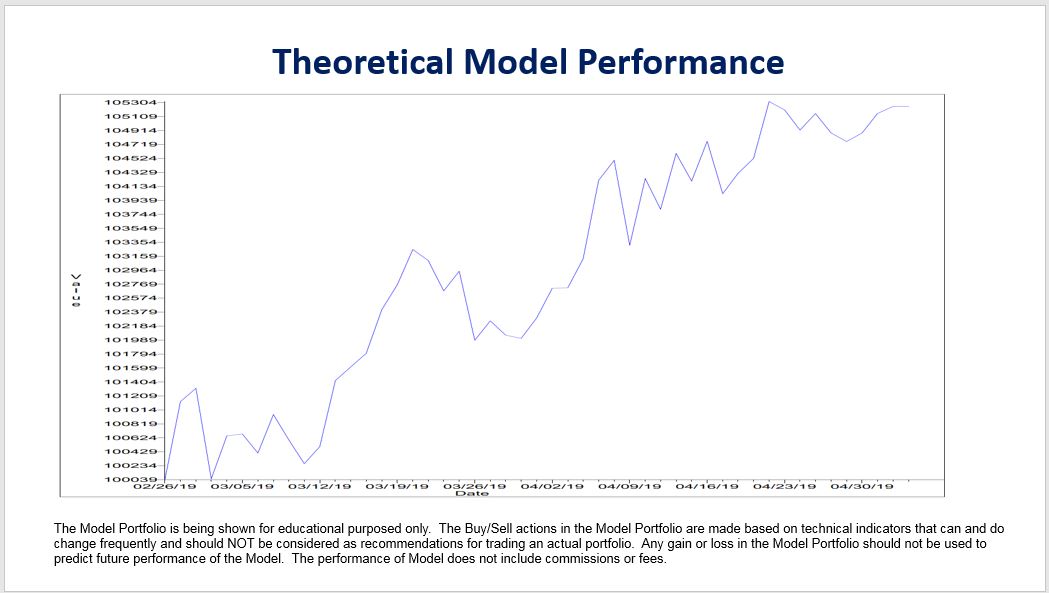
Model Portfolio: There were NO changes to the Model after yesterday’s session. The Model remains 100 percent in cash ($105,250.50) as it waits for the next signal change.
The Model continues to wait for the timing indicators on gold to turn positive. Friday’s 0.71 cent up move in GLD caused my VTI-volume indicator on the ETF to make a significant move up. It’s now very close to generating a Buy Signal. If the signal turns positive early next week, I will be adding gold shares to the Model. GLD appears to be in the process of completing wave ‘c’ of Major Wave 2 down. If this analysis is correct, gold (the metal) could be getting ready to begin a rally that would take it to the 1,600 level, possibly higher. Stay tuned.
After looking at a chart of crude oil this weekend, the Model will be looking to buy a full position of SCO, a 2X inverse leveraged ETF for West Texas Crude.
The chart suggests that crude oil is developing a long-term triangle. Because triangles are NOT trending patterns, the Model recently sold its shares of UCO, the positive ETF in the same fund family, when crude reached its price target near 66. If this analysis (triangle) is correct, the price of crude should begin to trade down to the 48 level during the next next few weeks. After that, crude should rally back to the 62 level trade as the triangle continues to develop.
So now that my VTI-volume indicator on SCO, the inverse ETF, has turned positive, it looks like a good time to re-enter the crude oil trade, only this time to the downside.
SCO closed at 15.72 on Friday. My target for this inverse ETF is near the 11 February high of 21.9. This high represents a natural target as it is the interim high between the first two lows of the decline that started last December.
BTW, longer term I’m very Bullish on crude oil. However the chart suggests that the triangle might take another 6-8 months before prices break out of the triangle and begin to move higher. So for now, crude oil is just a trade.
Looking to Buy SCO.
The Model Portfolio is being shown for educational purposed only. The Buy/Sell actions in the Model Portfolio are made based on technical indicators that can and do change frequently and should NOT be considered as recommendations for trading an actual portfolio. Any gain or loss in the Model Portfolio should not be used to predict future performance of the Model.
Have a great weekend.
That’s what I’m doing,
h
Market Signals for
05-06-2019
| DMI (DIA) | NEG |
| DMI (QQQ) | POS |
| A/D OSC | |
| DEANs LIST | POS |
| THE TIDE | NEG |
| Index | Signal | Signal Date |
|---|---|---|
| DOW | NEU | 02 May 2019 |
| NASDAQ | POS | 03 May 2019 |
| GOLD | NEG | 29 Apr 2019 |
| U.S. DOLLAR | POS | 23 Apr 2019 |
| BONDS | POS | 01 May 2019 |
| CRUDE OIL | NEG | 01 May 2019 |
Only getting the Professor’s Weekend Review? Try his daily update Cum Laude service for 2 weeks only $9.99 LEARN MORE
All of the commentary expressed in this site and any attachments are opinions of the author, subject to change, and provided for educational purposes only. Nothing in this commentary or any attachments should be considered as trading advice. Trading any financial instrument is RISKY and may result in loss of capital including loss of principal. Past performance is not indicative of future results. Always understand the RISK before you trade.

Category: Professor's Comments, Weekend Strategy Review