
Weekend Strategy Review May 12, 2019
Posted by OMS at May 12th, 2019
The recent extreme volatility continued in the markets on Friday. The Dow opened to the downside, dropping 359 points before rallying into the close. The Dow finally closed with a gain of 114 points at 25,942. The large cap index was down 562 points for the week. The NASDAQ was down 6 points of Friday and down 247 points for the week. This was the third consecutive week that the Dow has lost money.
So, what’s going on? Was Friday’s intraday low the bottom? Hmm? The area around 25,500, which is close to 200-day moving average support, has now been tested for two consecutive days, so it’s possible that some type of short-term bottom is in. On the other hand, the markets still appear to be in a larger Ending Diagonal Pattern, so the Thursday-Friday lows could only be marking the bottom of one of the legs of the Ending Diagonal. If this is the case, the markets could begin to rally again, delaying the major decline that I see coming until later this year.
The only thing clear to me at this point is that the markets are in trouble. Ending Diagonals are termination patterns. They are NOT patterns that develop at the beginning of a Bull Market. They are seen when a Bull Market is completing. So, the odds suggest that sometime between now and the end of the year, this market is going to take a major dive. And that’s the thing that we need to focus our strategy on this weekend.
As a trader, the past week has been wonderful for me. I love volatility! The intraday moves produce many opportunities for profit. But if you’re a longer term investor, the volatility probably drives you nuts! You see the Dow drop 562 points during the week and wonder, is the is the time to get out? Yeah, you’ve seen the market decline before, but it always seems to come back. You wonder if it will be different this time, or is what we’re seeing just another correction? Hmm?
Well, for starters, you should realize that the VZO on the Dow’s Weekly chart has turned negative. The last time this happened was on 12 October 2018. This led to a decline of over 3,600 Dow points. The thing that’s different about last October and now is that the momentum AND Money Flow were negative back then. Right now, these two indicators are still positive. Recall that I’ve been talking about Money Flow since the current decline started, saying that I haven’t seen the Big Boys throw in the towel yet. And even after Friday’s decline, I’m still not seeing a large amount of institutional selling. So, without this happening, any major decline will likely be put off until later this year.
All this means is that the Ending Diagonal Pattern will likely continue to develop for a few more months. But don’t let this fool you that this current market is on solid ground. It isn’t. As I’ve mentioned several times before, markets are driven by earnings. And the earnings behind the current market are for the most part ‘artificial’, obtained as a result of tax cuts and NOT by growth. So, don’t be fooled. The next quarter will likely see company earnings begin to reflect the real world, and they’re going to surprise a lot of people. This is what the Ending Diagonal Pattern is warning us about.
Anyhow, Friday’s decline and subsequent rebound caused all my market timing to turn Neutral. Except for a small short position in Crude Oil, I’m on the sidelines.
The Tide and the Dean’s List remain Negative.
The Sector Ration stayed at 16-8 negative after Friday’s session. This means that most of the sectors in the S&P 500 are declining. The Strong List was led by Real Estate, Insurance, Household Products, Food Drugs and Foods. Students should note that once again, the Weak List is being dominated by defensive issues, just as it was late last year. Gone are the semis, technology, computers, cap goods and financials…. all the sectors that appeared on the Strong List in January and powered the market higher. Now, toothpaste and toilet paper are back in favor again. This tells me that even if the market doesn’t decline over the short term, the odds for a significant rally are low. In other words, don’t expect to see a sustainable rally until the leading sectors begin to appear on the Strong List again.
The Weak Sector List was led by Service, Energy, Material, Healthcare and PharmaBio.
Remember, trading is an odds game. And all you can ever do is try to place the odds in your favor. Right now, with a 16-8 negative Sector Ratio, the odds DO NOT favor the long side.
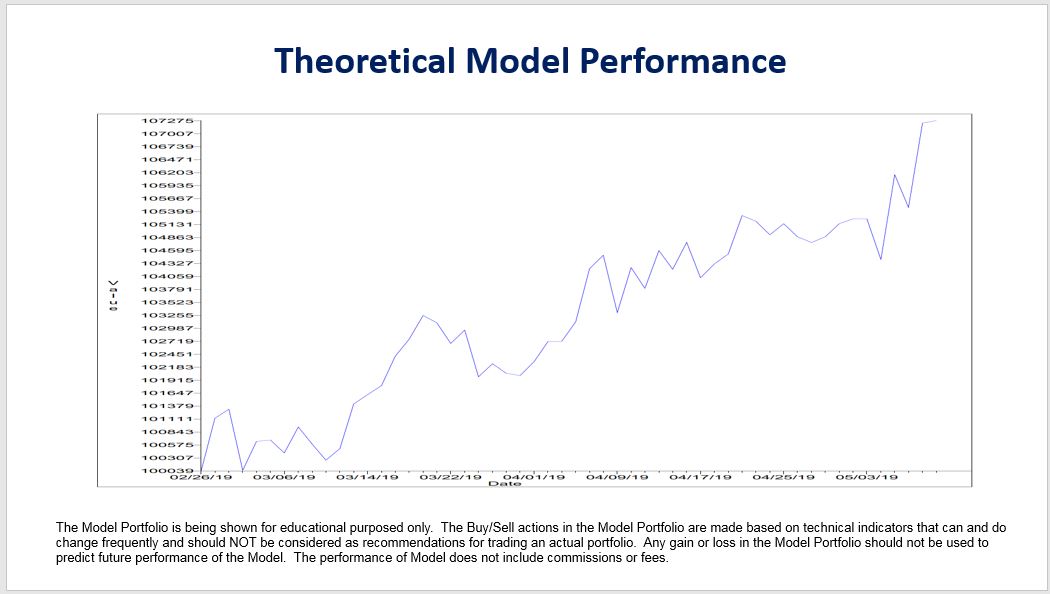
Model Portfolio: The Model Portfolio bought a small ‘trial’ position of SCO, the inverse ETF for West Texas Crude Oil. Price paid was 15.75 per share. So, except for the short position in Crude Oil and with Neutral Signals on the cockpit, the Model is now holding $91,479 in cash, waiting for the signals to change.
BTW, last week the Model was up 1.68 percent while the SPX was down 1.08 percent. Since inception, the Model is up 7.24 percent which translates to an annualized IRR of 41.14 percent. I’m still concerned about how the Model will perform during periods when the market is non-trending, as it is now. If it can remain profitable under these extremely stressful conditions, which are NOT the conditions the Model was designed for, it should do well once the market begins to trend. All I want to see it do now is have it hold its own against the SPX, which is what it’s doing. If the Model can do this, it should do fine. BTW, students should remember that back in early January, when I was evaluating the ‘Test Model’, the market began to trend. During this trend phase, the ‘Test Model’ was up over 20 percent in about six weeks. This is why I continue to be excited about the current performance of the Model.
The Model Portfolio is being shown for educational purposed only. The Buy/Sell actions in the Model Portfolio are made based on technical indicators that can and do change frequently and should NOT be considered as recommendations for trading an actual portfolio. Any gain or loss in the Model Portfolio should not be used to predict future performance of the Model.
Have a great weekend.
That’s what I’m doing,
h
Again, many thanks for the nice emails you’ve been sending me, especially those related to the Model. The Model is something I developed for you, so it’s nice to get your feedback. But if you really like what we’re doing now with the Model, our Classes and this web site, please tell your friends!
Only getting the Professor’s Weekend Review? Try his daily update Cum Laude service for 2 weeks only $9.99 LEARN MORE
All of the commentary expressed in this site and any attachments are opinions of the author, subject to change, and provided for educational purposes only. Nothing in this commentary or any attachments should be considered as trading advice. Trading any financial instrument is RISKY and may result in loss of capital including loss of principal. Past performance is not indicative of future results. Always understand the RISK before you trade.

Category: Professor's Comments, Weekend Strategy Review