
Weekend Strategy Review June 23, 2019
Posted by OMS at June 23rd, 2019
The markets pulled mildly back yesterday. The Dow finished with a loss of 34 points, closing at 26,713. The Dow was up 630 points on the week. The NASDAQ was down 20 points on Friday, but up 235 points for the week.
There were NO Changes to the market timing indicators for equities after yesterday’s session. The Dow, NASDAQ, SPX, and Russell 2K remain on Buy Signals
The Tide, Dean’s List, and DMIs remain positive. The Money Flow indicators on the Dow and NASDAQ remain positive.
The Sector Ratio weakened to 12-12 Neutral after Friday’s session. Aggressive Sectors, like Technology, Cap Goods, Financials and Computers moved back on the Weak List, near the bottom. Seeing the Ratio weaken and turn neutral was one of the reasons the Model bought a ‘trial’ position’ in TWM. The Strong Sector List was led by Real Estate, Household Products, Insurance, Telecoms, and Media. The Weak Sector List was led by Service, Energy, Retail, Semiconductors, and Autos. Students should note that Semiconductors have moved into the top 5 weakest sectors with Technology and Computers moving up on the Weak List. Hmmm? Pay attention if you currently own a lot of technology related stocks. Especially small cap technology stocks that could be impacted by rising interest rates…..
Model Portfolio: With the markets EXTREMELY overbought and near target highs, the Model purchased 1,000 shares of TWM, an Ultra Short (3x) inverse ETF for the Russel 2K.
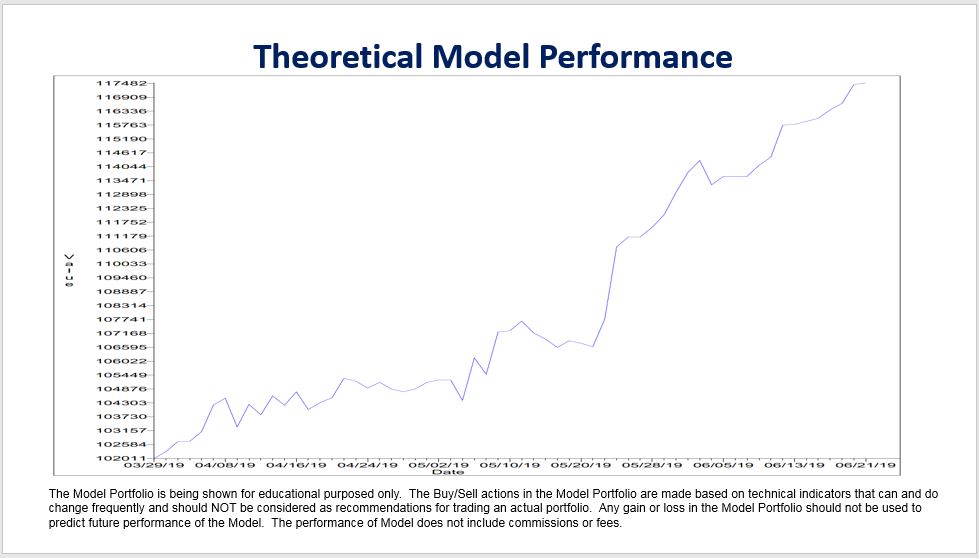
After yesterday’s session, the Model’s cash position was $102,345. The Model has now gained $17,465 since inception or 17.46 percent which translates to an annualized IRR of 65.91 percent. An chart is attached so you can see how the Model’s conservative approach using high probability trades has led to a steady increase in equity. BTW, IF a student followed all the timing signals on the cockpit during the same period, the gains would have been even higher! But that would entail a lot more risk, and that’s not what the Professor’s Methodology is about. If you’re willing to take on more risk, you might want to pay more attention to the timing signals. That’s why I put six of them on the cockpit, so you can use them as appropriate to help structure your individual portfolio.
The Model continues to watch Bonds. Yesterday, Bonds fell slightly causing TMF to drop 0.85 cents to 2.27. The last three days of trading in TMF have caused a ‘Star’ reversal pattern to form. This is coming at a time when Bonds are at their projected target high. Another thing that happened Friday was that my custom Money Flow indicator on TMF turned negative. This is the first time the indicator has been negative since turning positive on the 20 May when the current rally in Bonds began.
The primary reason I’m watching Bonds now is because the pattern suggests that a long term down trend could be getting ready to start. And given a choice between trading a stock or ETF in a trend vs. ETFs in a Non-trend, like UCO/SCO our two crude oil ETFs, I’d take the trending ETF in a heartbeat. It’s just easier. For example, since the beginning of June, we watched how gold performed once it started its Up Trend. The move was almost straight up. When you own something in an Up Trend and have a projected target that’s a lot higher than the price you paid, all you need to do is manage your money as the price continues to move higher. If you decide to take profit, it’s pretty easy to re-enter the trade once the equity pulls back causing the 2-period RSI to become oversold. Trading ETFs in an Up Trend is always easier than trading something in a triangle where you’re always worrying about changes in direction.
Anyhow, if Bonds start to trend, I might use some or all the funds in the Model Portfolio currently allocated for Crude Oil to trade Bonds. Our first trade will likely be with TBT, the inverse ETF for Bonds. My custom Money Flow indicator on TBT just turned positive, so we could be getting close to an entry point. Stay tuned.
BTW, another reason for trading Bonds is because they are a good indication of what is going on in the economy and the equity markets. If Bonds start to decline, it means that long-term interest rates are rising. This causes the price of homes and autos to become less affordable. This is one of the reasons you’re seeing the Auto Sector on the Weak List.
The Model Portfolio is being shown for educational purposed only. The Buy/Sell actions in the Model Portfolio are made based on technical indicators that can and do change frequently and should NOT be considered as recommendations for trading an actual portfolio. Any gain or loss in the Model Portfolio should not be used to predict future performance of the Model.
Have a great weekend.
That’s what I’m doing,
h
Market Signals for
06-24-2019
| DMI (DIA) | POS |
| DMI (QQQ) | POS |
| A/D OSC | |
| DEANs LIST | POS |
| THE TIDE | POS |
| Index | Signal | Signal Date |
|---|---|---|
| DOW | POS | 05 Jun 2019 |
| NASDAQ | POS | 13 Jun 2019 |
| GOLD | POS | 03 Jun 2019 |
| U.S. DOLLAR | NEU | 14 Jun 2019 |
| BONDS | POS | 19 Jun 2019 |
| CRUDE OIL | POS | 20 Jun 2019 |
Only getting the Professor’s Weekend Review? Try his daily update Cum Laude service for 2 weeks only $9.99 LEARN MORE
All of the commentary expressed in this site and any attachments are opinions of the author, subject to change, and provided for educational purposes only. Nothing in this commentary or any attachments should be considered as trading advice. Trading any financial instrument is RISKY and may result in loss of capital including loss of principal. Past performance is not indicative of future results. Always understand the RISK before you trade.

Category: Professor's Comments, Weekend Strategy Review