
Weekend Strategy Review January 19, 2020
Posted by OMS at January 19th, 2020
The markets were flat during most of Friday’s session, but then rallied into the close. The Dow finished with a gain of 50 points, closing at 29,348. The higher close was the ninth positive close in the first 12 trading days of the year, pushing the Dow to record highs. These record highs have also pushed the sentiment readings to new record highs, as just about all the sentiment readings I follow are now either at or have exceeded historic peak levels for the past several years. Sentiment is an interesting thing to follow, as it’s not like a DMI or a CCI that is generated directly from market movement. It measures how investors feel about the market.
When the market is falling, sentiment is low, mostly because investors are losing money. Bottoms are usually marked by EXTREMELY low sentiment readings. On the other hand, when the market is in a rally phase, as it has been for the past few months, sentiment gets pushed higher and higher as investors believe the rally will continue. But once sentiment reaches an EXTREME level, like it is now, it usually marks late stage of a rally. I believe this is where we are now.
Looking back, sentiment began reaching EXTREME levels in early January 2018, with some readings peaking as early as 4 January. However, it was not until 26 January 2018 that the Dow finally topped at 26,661. Nine trading days later, the Dow had fallen to 23,360, a loss of 3,256 points. Being long when sentiment reading are at EXTREMELY high levels usually results in EXTREME losses.
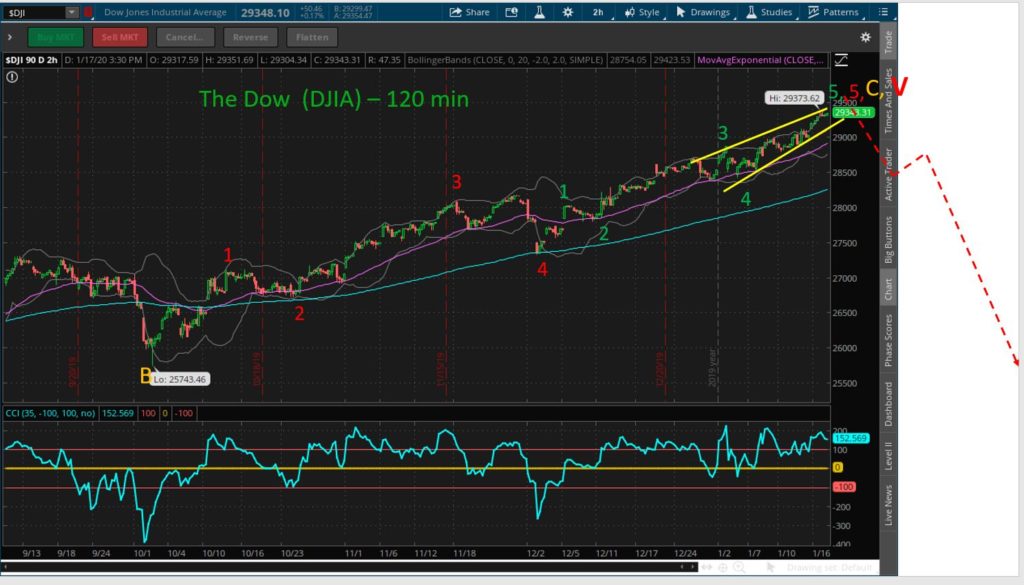
As for market’s current wave structure, it appears the current rally is a classic ‘throw-over wave’. This wave almost always marks the final wave in a five wave sequence. This particular ‘throw over’ is also occurring at the end of a Major Ending Diagonal Pattern which appears complete. There could be one more final push higher to complete mini-wave 5 of the sequence early next week, but it’s not required.
Despite the Friday’s late rally, the markets are beginning to look tired. There were just as many decliners on Friday as advancers, and the other breadth and volume measures I follow showed similar weakness.
One measure I found interesting is the A-D Indicator. On October 3, 2017, just before the Dow began to rally into the January 2018 high, the A-D indicator peaked at 386.8. Then as the Dow rallied into its January high, the indicator stayed well below the October high, finally reaching a lower high on 3 January…about three weeks before the market peaked. The reason I bring this up today is because the A-D indicator is acting almost exactly the same as it did back in January 2018. In the current rally, the A-D indicator peaked on 11 September at the 417 level. And as the rally continued, the A-D indicator stayed well below the 417 level. On Thursday, the indicator reached its highest level since last September (386.8), setting up another classic case of negative divergence. On Friday, the indicator began to fall.
So, all I’m doing now is waiting for the market to roll over.
The Dow, SPY, NASDAQ, and Russell 2K remain on Buy Signals. The Tide and Dean’s List remain Positive.
Students should remain on FULL RED ALERT and look for a decline below the lower trend line on the Dow now at the 29,050 level. A decline below this level will likely start the market moving lower and should result in a change to the market timing indicators. Any negative turn in the indicators now will likely signal that the top is in and the next Major Bear market is underway.
The Sector Ratio improved to 22-2 after Friday’s session. The Strong Sector List was led by Household Products, Healthcare, Semiconductors, Computers and PharmaBio. The two Weak Sectors were Banks and Autos.
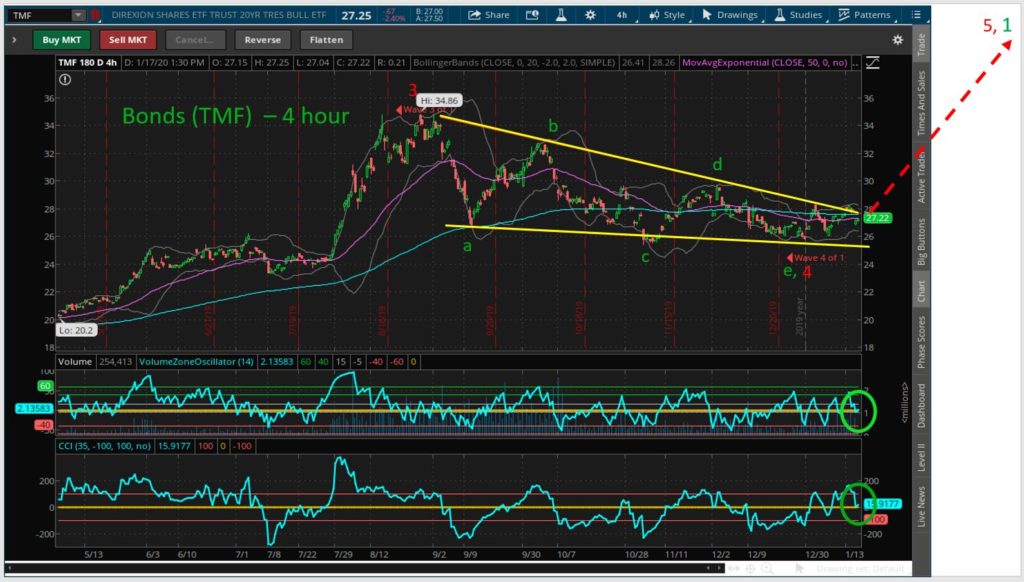
Model Portfolio: There were NO CHANGES to the Model after Friday’s session. The Model continues to hold 400 shares of TZA, 300 shares of VXX, 1,500 shares of DXD, 300 shares of SQQQ and 500 shares of TMF with a cash balance of $57,890. The recent rally has caused to Model’s gain to fall to 26.5 percent. While the Model is experiencing its first significant draw down since inception, I believe it is well positioned to take advantage of the decline that the sentiment, volume, and breadth indicators are predicting.
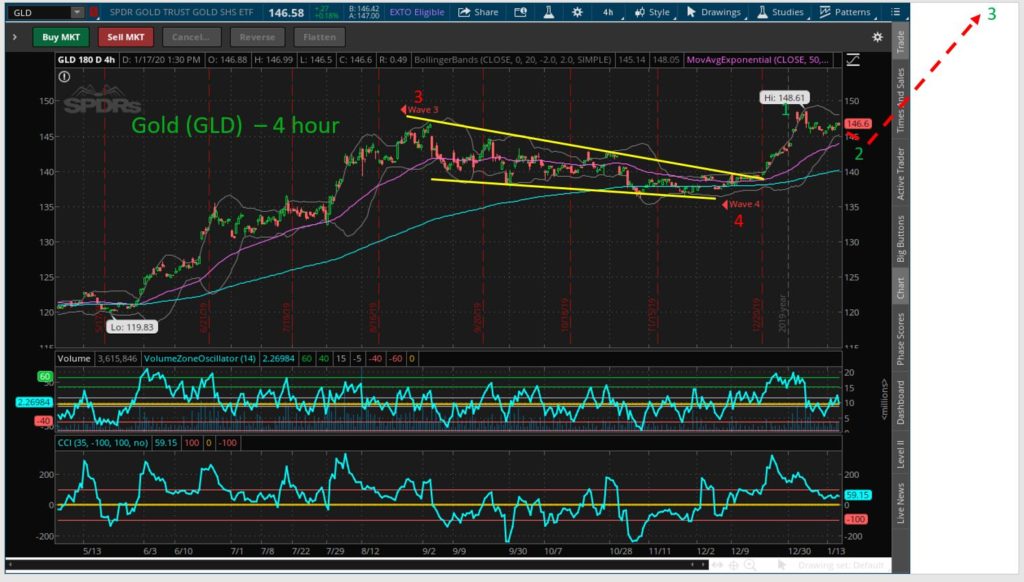
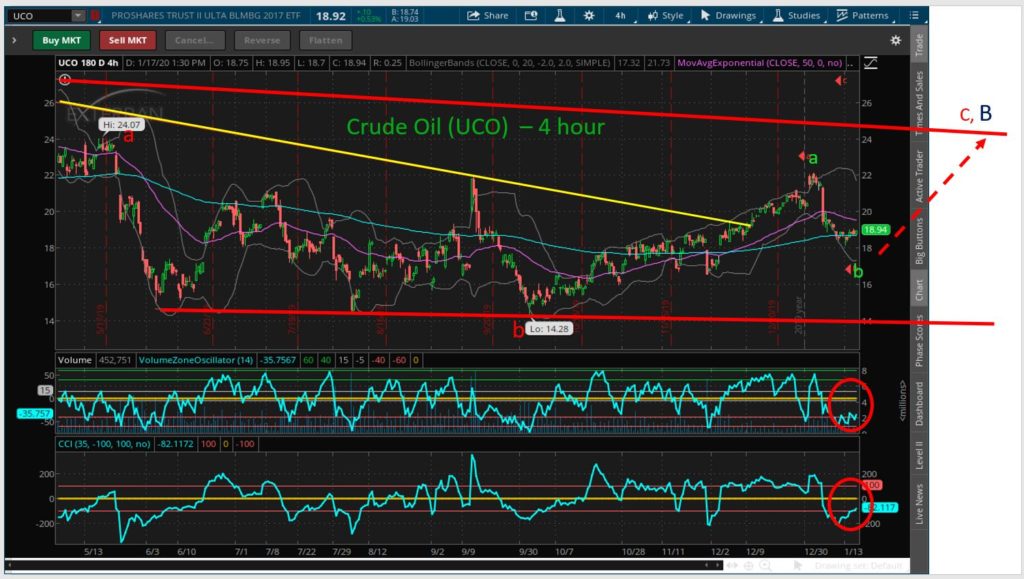
The stock market will be closed on Monday, 20 January, in observance of Martin Luther King Jr. Day. My next Update will be on Wednesday, 22 January. BTW, given that Monday is a Holiday, I will use the opportunity to post several charts on the Dow, gold, crude oil, and Bonds. I want students to understand the wave counts I’m using for these markets, so they can develop and plan their longer term strategies. Also, seeing the wave counts should help students understand why the Model is positioned the way it is.
That’s what I’m doing.
h
The Model Portfolio is being shown for educational purposed only. The Buy/Sell actions in the Model Portfolio are made based on technical indicators that can and do change frequently and should NOT be considered as recommendations for trading an actual portfolio. Any gain or loss in the Model Portfolio should not be used to predict future performance of the Model.
The attached charts for the Dow, Gold, Bonds, and Crude Oil are right from my Think or Swim screen. They show the wave counts I’m using going forward. The only chart I believe is confusing at this point is Crude Oil, as it remains in a complex triangle. This is the primary reason the Model is currently not involved with West Texas Crude.
Have a great Holiday weekend,
h
Market Signals for
01-21-2020
| DMI (DIA) | POS |
| DMI (QQQ) | POS |
| A/D OSC | |
| DEANs LIST | POS |
| THE TIDE | POS |
| Index | Signal | Signal Date |
|---|---|---|
| DOW | POS | 11 Dec 2019 |
| NASDAQ | POS | 12 Dec 2019 |
| GOLD | POS | 17 Jan 2020 |
| U.S. DOLLAR | NEU | 08 Jan 2020 |
| BONDS | NEU | 17 Jan 2020 |
| CRUDE OIL | NEG | 10 Jan 2020 |
DISCLAIMER
As always, the Professor never makes recommendations. The information is provided on an educational basis so you can have informed discussions with your financial advisors and/or accountants about your individual investment decisions.
All of the commentary expressed in this site and any attachments are opinions of the author, subject to change, and provided for educational purposes only. Nothing in this commentary or any attachments should be considered as trading advice. Trading any financial instrument is RISKY and may result in loss of capital including loss of principal. Past performance is not indicative of future results. Always understand the RISK before you trade.

Category: Professor's Comments, Weekend Strategy Review