
Weekend Strategy Review August 29, 2015
Posted by OMS at August 29th, 2015
The Dow fell 12 points on Friday, closing at 16,643. It was up 183 points for the week. The NASDAQ was up 16 points on Friday and up 122 points for the week.
It appears that wave 4 up of Major Wave 1 down is nearing completion. The 10 min chart of the DIA that I mentioned yesterday is showing a picture perfect 5 wave pattern that is likely the final wave of the triangle pattern. This triangle pattern has developed since wave 3 down bottomed on Monday. If I’m correct about the pattern, the markets should start moving lower early next week.
The Dean’s List remains short and negative. However two days ago, The Tide turned neutral and both Money Flow indicators turned positive. This is what usually happens during a retracement wave. And given that Monday’s decline was impulsive, it’s likely that the past few days are part of a normal wave 4 corrective retracement, meaning that another significant decline is coming early next week.
I am expecting this wave down to take the Dow below the 15,000 level. Then once Major Wave 1 down completes, there should be a strong rally into early October takeing the Dow back to 16,500 before the market starts its major plunge.
BTW, the wave 4 triangle is very similar to what we saw during the market crash of 2008. After an impulsive decline, the Dow appeared to bottom on 21 November 2008 at the 8,046 level. It then rallied for 2 months to form a retracement triangle, but once the triangle completed, it fell another 1,600 points to 6,440 before the decline was over. Triangles are consolidation patterns. They are never reversal patterns. The rule is that once a stock enters a triangle, it leaves in the direction it entered the triangle. So if we see choppy, up down up trading after an impulse wave down like we saw this past week, we must always think triangle first. So until proven otherwise, I have to be looking for lower prices.
Yesterday I was watching several 10 minute charts of the major indexes, looking for the indicators to turn negative and signal that the final leg of the wave 4 triangle was completing. A few turned negative, but for the most part, the Money Flows remained positive. So on Monday, I will continue to watch the 10 minute bars on the indexes for a signal. If they turn negative, I will look to add to the inverse index ETF positions I have already established.
However, I should tell you that because I already have a significant position in these inverse ETFs, I really want to see the market start dropping with conviction before I add to these positions. The fact that both Coaches are Green is telling me that money is still flowing into the market, and it’s not likely that wave 5 down will start until they turn negative.
Anyhow, since I had my Class About Nothing last Tuesday night, I have received several requests for a ‘Screen Shot’ of the trading screen I have been using for the past few weeks. As most of you know I use three basic indicators to trigger my Buy-Sell decisions.
I always start with the pattern. There MUST be a pattern on the price chart for me to initiate a trade. If I don’t see a pattern, I don’t trade. And anytime I believe the market is in a corrective triangle, I start looking to trade the choppy waves on the shorter term bars. This is why I’m trading the 10s now. If the market starts its wave 5 decline, then I’ll likely switch back to the 15s or 30s , or even hourly bars which produce less fluctuations in the indicators. But during retracement waves, I always like to use the shorter term bars. This especially true now because I’m really not that worried if Ithe inverse position I enter on the 10s turns out to be a false early signal. I’m Ok with holding the position, because I know that the odds are overwhelmingly in my favor that the next major move will be down.
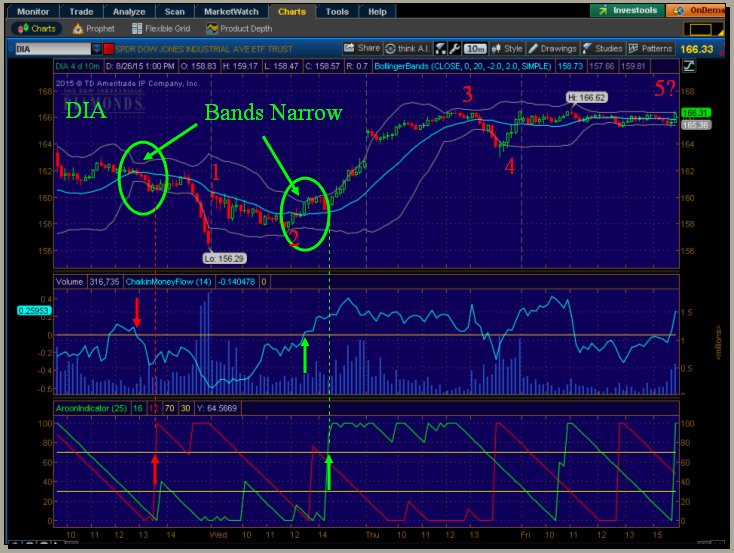
The attached 10 min chart of the Dow shows how I have been using Money Flow and Trend indicators to trade the triangle. For the purposes of this discussion, I have not included an overbought or oversold (OB-OS) indicator on the chart, because I only want to show you a few basic trend trades. But normally I would have some type of OB-OS indicator, like a 2 period RSI or a fast stochastic at the bottom of the chart. I’ll talk more about how I use the OB-OS indicators with the Chaikin and Aroon at a later date, but for now, I just want you to concentrate on trading a trend. It’s a LOT easier. BTW, these same indicators can also be used on your daily charts.
Ok, so the first thing I look for is a pattern. In this case, because the overall pattern is a triangle, I’m looking to trade the various legs of the triangle as they develop. So I’m looking for times where the Bollinger Bands are narrowing to signal a possible change of direction.
If you look at the attached chart, you will see two times where the Bands narrowed setting up one short and one long trade. Remember, these are very short term trades within a triangle, so you have to be on your toes.
So after I see the Bands narrow, I start watching the indicators. Again, its ALWAYS pattern first, then indicators.
The attached chart shows a 14-period Chaikin Money Flow indicator, but you can use other Money Flow indicators if you don’t have access to the Chaikin. Also shown at the bottom is a 25-period Aroon Trend Indicator. You can use either the Aroon or a 35-period CCI. Doesn’t rally matter that much. Both will do the job. BTW, for thise of you who are using the DMI, ther’e nothing wrong with this. But you should understand that the Aroon acts like a normal DMI when the Red and Green indicators cross, so its redundant to have both indicators on your trading screen when you are using the Aroon.
Anyhow, after I see the Bands narrow I start looking for a change in Money Flow. Money Flow is usually the first indicator to turn. So last Tuesdaty when the Bands started to narrow in the early afternoon and I saw the Chaikin turn negative, it told me the DIA was setting up for a potential decline. And because the Bands were narrow I knew that the move could be significant. So I waited to see if a trend was developing. At 13:30, the Red Aroon moved above 70, telling me a down trend was starting. This was my signal to start buying a few DXDs, the inverse index ETF for the DIA. All I did after that was monitor the trade, exiting the position near the close. Note how both the Chaikin and the Aroon stayed in a down trend for the rest of the day keeping me in the trade.
The following day, the Bands narrowed again, setting up another trade, but this time to the up side. Once again just after noon, I saw the Chaikin turn positive with narrow Bands. About 2-hours later, the Aroon entered the Trend Mode telling me the final leg of the rally I had been expecting was underway. It turned out to be a nice move.
Anyhow, this is all I have been doing for the past few days. Watching the Bands and then trading the indicators on the short term bars. But like I said, IF the market starts to decline early next week, I will likely switch to a slightly longer time period, like the 30s or 60s. I like the longer time periods once the market starts to move out of a consolidation pattern and back into the trend mode. The longer time periods tend to keep me in the trend longer. Then if the market starts to approach my lower targets, I’ll switch back to the shorter term bars for an early indication to get out.
Have a great weekend.
That’s what I’m doing,
h
| Market Signals for 08-31-2015 |
|
|---|---|
| DMI (DIA) | NEG |
| DMI (QQQ) | NEG |
| COACH (DIA) | POS |
| COACH (QQQ) | POS |
| A/D OSC | |
| DEANs LIST | NEG |
| THE TIDE | NEU |
| SUM IND | NEG |
All of the commentary expressed in this site and any attachments are opinions of the author, subject to change, and provided for educational purposes only. Nothing in this commentary or any attachments should be considered as trading advice. Trading any financial instrument is RISKY and may result in loss of capital including loss of principal. Past performance is not indicative of future results. Always understand the RISK before you trade.

Category: Professor's Comments, Weekend Strategy Review