
Weekend Strategy Review April 26, 2015
Posted by OMS at April 26th, 2015
Since 6 March, the Dow has had the following weekly moves:
-276 points, -108 points, +378 points, -415 points, +50 points, +294 points, -232 points and up 254 points.
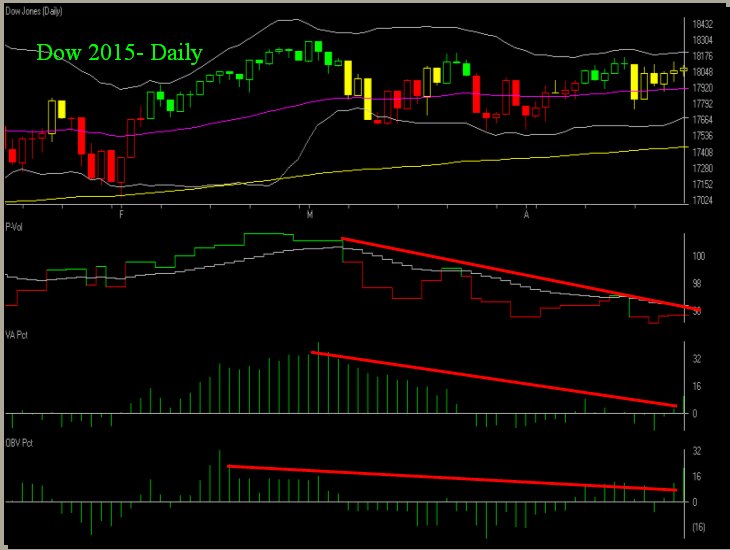
On 6 March, the Dow was trading at 17,857. On Friday it closed at 18,080 for a net gain of 223 points. So in eight weeks, the Dow has gained 223 points.
Meanwhile, the volume shown on the first Daily chart of the Dow (attached), has been declining steadily.
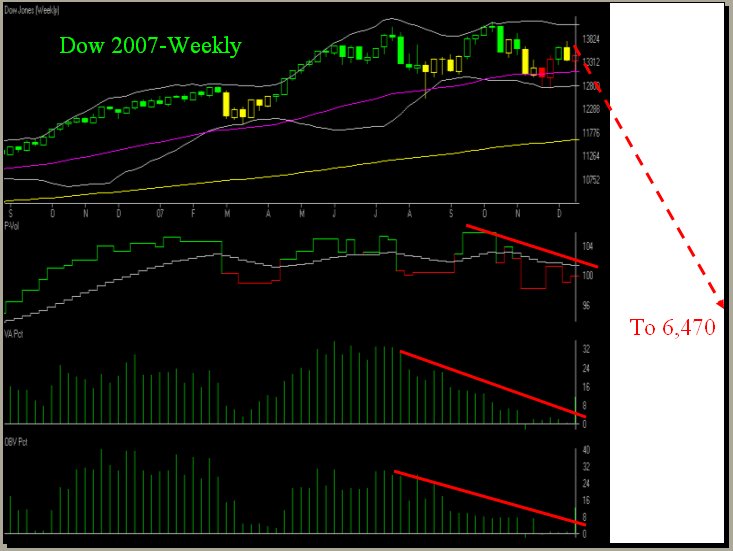
The second Dow chart depicts the same volume measures on a weekly chart during the later part of 2007. Take a close look at these volume measurements and compare them to what you see on the first chart. Do they look similar? Hmmm? Heck, they almost look identical!
Most of us still remember what happened after 21 December 2007, the last day on the chart. But in case you forgot, the Dow proceeded to fall from 13,451 to 6,470.
OK, so while you’re still looking at the second chart, take a look at the price pattern. Notice how for the last 6 months of 2007, the price didn’t go anywhere? Now compare this to the price pattern on the current Dow chart. It is very similar to what we’re seeing now!
Technicians call this sideways pattern…distribution. The pattern forms when smart money investors start to take profits and sell their stock to the uninformed. During the distribution phase, the market experiences a lot of churning without going anywhere. Then once ALL of the stock has changed hands, the smart money stops buying. They don’t stop buying all at once. They do it slooowly. It takes time to dump all of the stock they have accumulated since the bottom in 2009. They start dumping by sectors. The weaker sectors get sold first until everything is gone. Then once ALL the stock is in weak hands, the market starts to decline.
This appears to be what’s starting to happen now.
I believe that we’re very close to a major top in the market. It could happen early next week if I’m right about the wave count for the Dow being a wave 2 of 3 down. Or it could happen in a few weeks IF wave ‘c’ up is in the process of completing.
If it’s wave 2 of 3, the Dow could have an early pop on Monday, probably to 18,130-18,150, and then start to decline. If it’s a wave ‘c’, the Dow should chop higher and exceed 18,300+.
Either way, the upside appears limited.
Many sectors have already started to roll over. Money is now flowing out of the aerospace, autos, building, consumer goods, chemicals, household, insurance, finance, and leisure sectors. The only thing these sectors need for a major decline to start is momentum shift.
As the Dow and the other major indexes continue to push higher, I’m seeing fewer and fewer sectors participating in the advance. Again, this is a Classic sign distribution and is what typically happens as the market approaches a major top.
I mentioned Money Flow again this week, because it is one of my key indicators for measuring the markets.
During the past few weeks, we have seen the Coach, my primary Money Flow indicator on the Dow and QQQ, flip-flop several times as the indexes trace out the final waves of the pattern. This is normal. As long as the Coach and The Tide stay positive, it’s likely the markets will chop higher. However IF they start to turn negative early next week, please be careful.
I tried to show you the similarities between the current market and what happened in the late 2007 for a reason. I believe that there is real danger ahead. The decline that I anticipate could start as early as next week, or it could start in a few weeks if the current rally is part of wave ‘c’ up. There is no way to tell. As long as the Dow stays below 18,289, I’ll stay with my wave 2 of 3 scenario. IF it exceeds 18,289, it’s likely the wave ‘c’.
Either way, the odds of a major decline starting within the next few weeks are high. Like I said, the market will likely push higher until the smart money unloads ALL of its stock. This is starting to happen now in the sectors I mentioned above. During the next few weeks, look for the Money Flow to turn negative in more and more sectors. That’s when it will become apparent that a major decline is underway.
So this week, watch the Coach and The Tide. If these indicators turn negative, I’ll start becoming very aggressive to the short side.
BTW, my gold trade did NOT trigger on Friday. The down leg that I anticipated and talked about on Friday occurred causing the PT indicators on RGLD to remain negative. However I’m still VERY interested in this trade. IF the PT indicators on the shorter term bars of RGLD turn positive early next week, I’m a buyer.
Have a great weekend.
That’s what I’m doing,
h
| Market Signals for 04-27-2015 |
|
|---|---|
| DMI (DIA) | NEG |
| DMI (QQQ) | POS |
| COACH (DIA) | POS |
| COACH (QQQ) | POS |
| A/D OSC | |
| DEANs LIST | POS |
| THE TIDE | POS |
All of the commentary expressed in this site and any attachments are opinions of the author, subject to change, and provided for educational purposes only. Nothing in this commentary or any attachments should be considered as trading advice. Trading any financial instrument is RISKY and may result in loss of capital including loss of principal. Past performance is not indicative of future results. Always understand the RISK before you trade.

Category: Professor's Comments, Weekend Strategy Review