
Professor’s Comments March 20, 2015
Posted by OMS at March 20th, 2015
The Dow fell 117 points, closing at 17,959. Volume was moderate, coming in at 94 percent of its 10-day average. There were 139 new highs and only 36 new lows.
Yesterday I mentioned that even though The Tide had turned positive, it was just barely positive. And that any pullback would likely turn it back to neutral again. And that’s what happened. Actually 3 of the 4 breadth indicators that make up The Tide are negative now, with the most important indicator, the A-D oscillator, being negative. The lone positive holdout is the Hi-Lo indicator. Yesterday’s small number of new lows was what kept The Tide from turning negative.
So we’re back to mixed signals.
It’s still possible that yesterday’s decline was the start of wave 3 down, but with the Dean’s List and Coach still being positive, I can’t be sure.
The other possibility is that yesterday’s decline was part of some type of new wedge or diagonal pattern that eventually will take prices higher. At this point I’d rather not discuss this pattern because even if it is occurring, I’m not sure that I would want to trade it. Yeah, the Dow would likely make it back to 18,300+, but it would not be straight up. The rise to the top would be extremely choppy and could terminate on any one of the legs. So for now, I don’t even want to think about trading this pattern IF it is developing.
So for now, my primary scenario remains that wave 2 topped at 18,097 after the Fed rally.
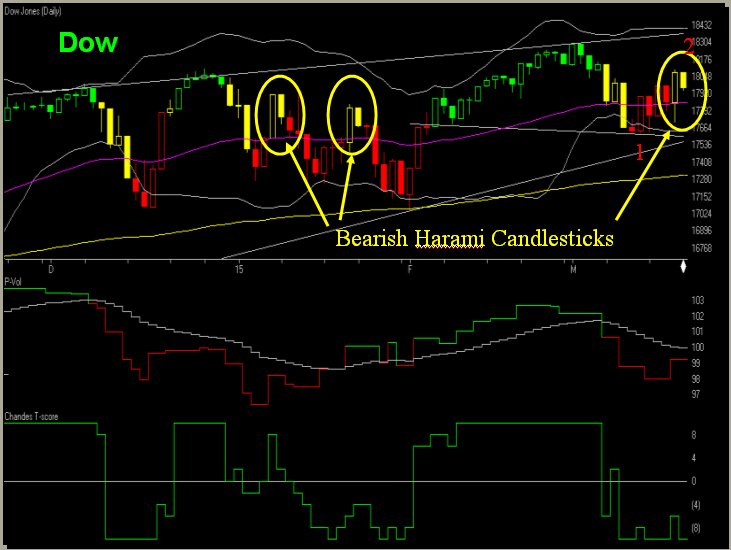
One of the reasons I say this is because of yesterday’s trading action when viewed on a candlestick chart.
With Japanese candlesticks, a bearish Harami is defined as an upward hollow body candlestick that engulfs a small negative candlestick, indicating of potential reversal of the Uptrend. I take it a step further because I color code my candlesticks based on what the DMI and MACD are doing. So when both the DMI and MACD are positive, I color the candlestick Green. When the DMI and MACD are negative, I color the bar Red. And when the indicators are mixed, as they were yesterday, I color the bar Yellow. By color coding the bars, I don’t have to look at the individual indicators.
When I’m looking for Haramis, I pay particular attention to those that are colored Yellow. That’s because it’s a lot easier for the market to reverse when the indicators are already mixed.
Anyhow, from the chart posted with today’s Comments, you can see several Yellow Haramis and how the market reversed each time one appeared.
It’s not a lot to go on, especially with a positive Dean’s List and Coach staring me in the face. But with a Yellow Tide that could be in the process of turning negative and the appearance of the bearish Harami, I’m going to wait until the mixed indicators are resolved.
That’s what I’m doing,
h
| Market Signals for 03-20-2015 |
|
|---|---|
| DMI (DIA) | POS |
| DMI (QQQ) | POS |
| COACH (DIA) | POS |
| COACH (QQQ) | POS |
| A/D OSC | |
| DEANs LIST | POS |
| THE TIDE | NEU |
Not sure of the terminology we use? Check out these articles
The Hockey Stick Pattern
The Creation of Waves and Trends
FAQ
All of the commentary expressed in this site and any attachments are opinions of the author, subject to change, and provided for educational purposes only. Nothing in this commentary or any attachments should be considered as trading advice. Trading any financial instrument is RISKY and may result in loss of capital including loss of principal. Past performance is not indicative of future results. Always understand the RISK before you trade.

Category: Professor's Comments