
Professor’s Comments June 26, 2014
Posted by OMS at June 26th, 2014
The Dow rose 49 points, closing at 16,867. Volume was moderate on the rally, coming in at 102 percent of its 10 day average. There were 156 new highs and 26 new lows.
Not much changed with yesterday’s small rally. It still appears that the markets are completing the rally wave that started back in mid-May and ready to start the next corrective leg down.
The Dean’ List and cockpit indicators remain positive, but yesterday the DMI on the Dow (DIA) turned negative joining the P-volume. Now the only PT indicator that remains positive is the MACD.
Market breadth is still pretty strong, but the Hi-Lo indicator has started to turn south. At this point, all of the other breadth indicators remain positive, but a few like the A-D oscillator and the Up-Down oscillator have moved into neutral territory. If the market has a bad day now, it’s likely that all of these breadth indicators will turn negative.
With the DMI turning negative on the DIA, I stopped by The Professor’s office last night to see what he was doing. Not much. The sign on his door said 2 longs and 3 shorts = NO TREND. So without a new trend starting, the negative DMI turn on the DIA can not be confirmed.
Same for Emeritus. If you’ve been watching the Honor Roll lately, it’s been awfully quiet. In other words, Emeritus isn’t seeing a lot of new stocks that are entering trend modes. This usually happens when the market is in a transition phase.
So with a flat market that could be ready to start a new leg down, I’m on the sidelines. I never like to force trades, and IF I traded now based on the mixed signals currently on the Board,…. that’s exactly what I would be doing.
h
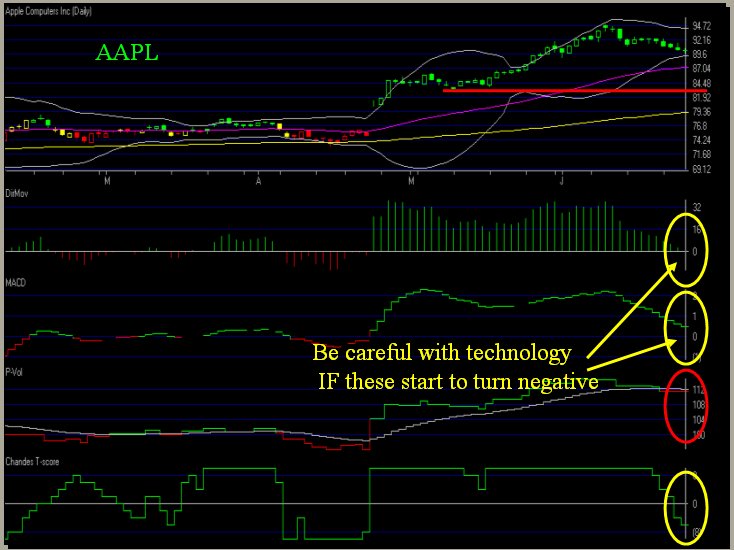
BTW, a few days ago, I mentioned that I was watching Apple (AAPL) after it’s recent THT Pattern. Since my comments, the stock has continued to pull back, and now the DMI and MACD could be ready join the P-volume in negative territory. The T-Score has turned negative but has not reached the –10 level indicating that a new down trend is starting. If AAPL does start to turn negative in the days ahead, it would be negative for technology stocks. As you can see from the attached chart, the interin low between the first two highs (the potential target for a decline after a THT Pattern) is at the 83 level. AAPL is currently trading above 90.
| Market Signals for 06-26-2014 |
|
|---|---|
| DMI (DIA) | POS |
| DMI (QQQ) | POS |
| COACH (DIA) | POS |
| COACH (QQQ) | POS |
| A/D OSC | |
| DEANs LIST | POS |
Not sure of the terminology we use? Check out these articles
The Hockey Stick Pattern
The Creation of Waves and Trends
FAQ
All of the commentary expressed in this site and any attachments are opinions of the author, subject to change, and provided for educational purposes only. Nothing in this commentary or any attachments should be considered as trading advice. Trading any financial instrument is RISKY and may result in loss of capital including loss of principal. Past performance is not indicative of future results. Always understand the RISK before you trade.

Category: Professor's Comments