
Weekend Strategy Review July 2, 2017
Posted by OMS at July 2nd, 2017
The Dow rose 63 points on Friday, closing at 21,350. It was down 45 points for the week. The NASDAQ finished down 4 points on Friday and down 125 points for the week.
Friday’s action on the Nasdaq 100 (QQQ), was exactly as expected, given its pattern. After completing five waves down for minor wave 1 down, we expected the Q’s to continue the minor wave 2 retracement that started late Thursday. Once this retracement is complete, minor wave 3 down should begin, dropping the Q’s to 200-day moving average support near the 128 level. QID, the inverse index ETF for the NASDAQ is back on the Dean’s List, near the top.
Again, I’m watching (and trading) the Q’s because of its inverse Hockey Stick Pattern and the fact that the PT indicators are on Sell Signals. The patterns and indicators on the other indexes are not nearly as clear as they are on the Q’s, and because of this, we’re seeing still seeing wild swings in their prices. We saw this again on Friday as the Dow rose almost 140 points before pulling back to close up 63 points. Price swings like this usually occur when traders can’t make up their minds about the direction of the market. They tend to occur whenever the market is approaching a major top. By themselves, they are a significant warning.
Anyhow, because of the topping action I’m starting to see in the major U.S. markets, I thought I would look at a few international markets this weekend. Last month, I mentioned that several of the major markets in Europe also appear to be forming major topping patterns that should be watched closely. I talked about how the ETFs for Germany (EWG), France (EWQ), and Sweden (EWD) were still on the Dean’s List which told me that Europe was still OK. But now, a month later, the troublesome patterns are still there, but EWG and EWQ are no longer on the List. Hmmm?
Why am I concerned about this? Well, the pattern for the German DAX, is very similar to the large Ending Diagonal on the Dow. The pattern started in March 2009, just below the 4,000 level and has risen in five waves to where it is today at 12,416. Ending Diagonals tend to be very reliable patterns. The problem is that once complete, the target for the pattern is always where the pattern began. In this case, it’s back to the 4,000 level. That’s right, 4,000 is no typo. It’s the target for the DAX based on technical analysis of the pattern. A break of the lower trend line of the Ending Diagonal, currently near 11,500, would confirm that the decline has started. But with this type of decline staring me in the face, I don’t have to wait until I see 11,500 broken. The fact that EWG, the ETF for Germany, is no longer on the Dean’s List is enough to get me concerned. Once the decline starts, EWG currently trading near 30 could fall to about 12.
Same for the French CAC. The French CAC also bottomed in March 2009, but in eight years, only regained about half of the previous high made in December 2007. The French markets never got the stimulus that helped goose the DAX and DOW. The pattern is more of an a-b-c wave 2 retracement. It still suggests another decline is in the cards that will drop the CAC from 5,155 to about 2,500 over the next few years. Not seeing EWQ on the Dean’s List is cause for concern.
BTW, the British FTSE is very similar to the French CAC. It bested its 2007 high of 6,750 exceeding 7,500 recently, but the pattern still appears to be an a-b-c retracement that is nearing completion. If I’m right about the pattern, the FTSE could decline to the 8,000 level during the next 2 years.
Closer to home, Canada’s TSA is another index to watch. The Canadian markets generated a Sell Signal last week, but EWC , the ETF for Canada, is still on the Dean’s List. If EWC drops of the List this week next week, it would be a very negative sign for the U.S. markets. The pattern on the TSA suggests a 40-50 percent decline is possible during the next 2 years, dropping the index from current levels near 15,180 to below 8,000. EWC could fall from 27 to about 14.
Bottom Line: Markets do not trade in a vacuum. So, when I see the European and Canadian markets forming major topping patterns that match what I’m seeing in the charts of U.S. markets, it’s cause for concern.
This is one of the reason’s I’ll be watching the Q’s next week. If the Q’s start an impulsive move down after the a-b-c retracement of minor wave 2 up completes, it would suggest a move down to the 128 level. Then IF this level is broken, it would constitute a ‘Rope Jump’ and identify the move as Major Wave 1 down in a new Bear Market. Like I said, markets don’t trade in a vacuum.
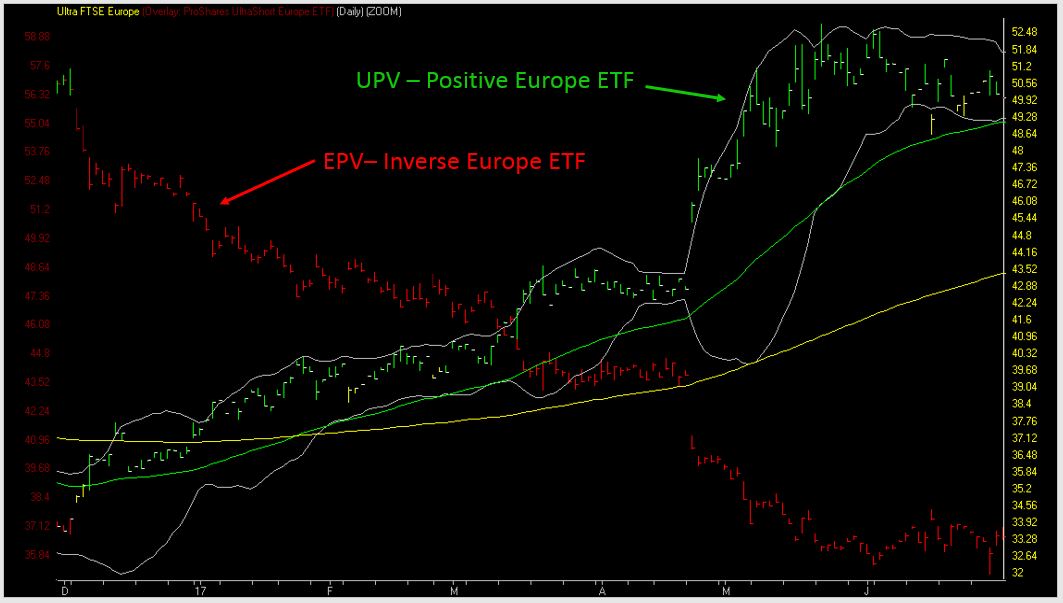
After looking at the charts of the European markets, I noticed that while several country ETFs were in the Data Base for the Dean’s List, a broader ETF for Europe was not.
EPV, the 2X leveraged inverse ETF for Europe, was already in the data base, so I decided to add UPV, the 2X leveraged positive ETF for Europe from the same family as EPV.
This way you will have another set of ‘Sticks in the Sand’ for Europe (see attached chart).
BTW, EUFN, the ETF that tracks the European Financials, is in the data base, and has good correlation with UPV. Same for EWG, the ETF for Germany. Both EUFN and EWG have been on the Dean’s List since mid-December.
So IF EUFN, UPV and EWG are replaced by EPV in the weeks ahead, you’ll know that European stocks are in trouble.
Remember, in the Professor’s Methodology, we use Patterns, Indicators, AND Lists to trade the markets. Right now, we have negative patterns on all European markets. But the indicators are only negative on EWG, and not on EUFN or UPV.
That’s why I’m just watching Europe for now. I’m waiting for EPV to replace the positive European ETFs.
h
Market Signals for
07-03-2017
| DMI (DIA) | NEG |
| DMI (QQQ) | NEG |
| COACH (DIA) | NEG |
| COACH (QQQ) | NEG |
| A/D OSC | |
| DEANs LIST | NEU |
| THE TIDE | NEU |
| SUM IND | NEG |
| VTI | NEG |
Only getting the Professor’s Weekend Review? Try his daily update Cum Laude service for 2 weeks only $9.99 LEARN MORE
All of the commentary expressed in this site and any attachments are opinions of the author, subject to change, and provided for educational purposes only. Nothing in this commentary or any attachments should be considered as trading advice. Trading any financial instrument is RISKY and may result in loss of capital including loss of principal. Past performance is not indicative of future results. Always understand the RISK before you trade.

Category: Professor's Comments, Weekend Strategy Review