
Professor’s Comments October 30, 2015
Posted by OMS at October 30th, 2015
The Dow fell 24points, closing at 17,756. Volume was on moderate, coming in at 104 percent of its 10-day average. There were 89 new highs and 43 new lows.
Not much changed yesterday. It appears that the Dow continues to form final wave 5 of wave ‘c’ of Major Wave 2 up. If my wave count on the 5 min bars is correct, yesterday’s sideways trading was likely a mini-wave 4 of the final wave. So one more wave higher, probably another 100+/- points or so, should do it.
Yesterday’s early decline followed by the retracement rally I talked about in yesterday’s Comments looked like it had the right stuff for waves 1 and 2 down, but after these waves completed, the impulse wave down never materialized. Instead, the Dow made a late rally into the close, making a new rally high. The new high means that the yesterday’s down-up action was most likely mini-wave 4 and not the first two waves of Major Wave 3 down. So we have to wait.
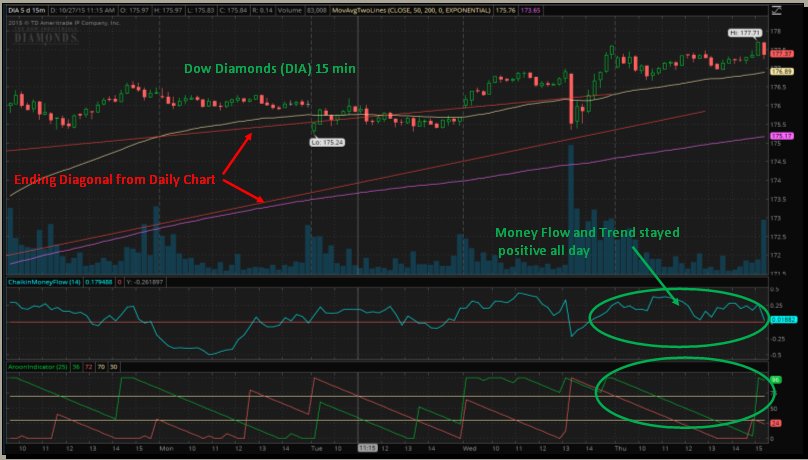
The length of a wave 5 usually equals the length of wave 1. So IF this holds true, wave 5 should complete just under 17,900. However a wave 5 within an Ending Diagonal can and usually does truncate, so I’m going to use 17,850 as my target, +/- 50 points.
In other words, IF the Dow starts its mini-wave wave 5 rally today, and approaches the 17,800 level, I’ll start watching the 15 minute bars for signs of a top.
I’ll be looking for my Money Flow, trend, and momentum indicators to turn negative. This could happen later today.
If you look at the attached 15 min chart of the Dow (DIA), you will see that even though the initial move out of the gate yesterday was down, the Money Flow and trend indicators (Aroon) remained positive and stayed positive all day yesterday. The indicators were saying that Major Wave 3 down was NOT starting. So given that the wave count suggests that final wave ‘c’ up appears to be nearing completion, continue to watch these indicators for the first sign that the top is in.
You might also want to watch these same indicators on the hourly bars for confirmation. When the hourly bars start to turn negative, we should start to see changes in The Tide, and perhaps even see TWM re-appear on the Dean’s List. The reason I say this is because the Russell 2K is the weakest index of the four majors. The RUT remains well below its summer high. So when the market turns, I would expect TWM, the inverse ETF for the Russell 2K to be the first to re-appear on the List.
Waiting,
That’s what I’m doing.
h
Market Signals for
10-30-2015
| DMI (DIA) | POS |
| DMI (QQQ) | POS |
| COACH (DIA) | POS |
| COACH (QQQ) | POS |
| A/D OSC | |
| DEANs LIST | POS |
| THE TIDE | POS |
| SUM IND | POS |
Not sure of the terminology we use? Check out these articles
The Hockey Stick Pattern
The Creation of Waves and Trends
FAQ
All of the commentary expressed in this site and any attachments are opinions of the author, subject to change, and provided for educational purposes only. Nothing in this commentary or any attachments should be considered as trading advice. Trading any financial instrument is RISKY and may result in loss of capital including loss of principal. Past performance is not indicative of future results. Always understand the RISK before you trade.

Category: Professor's Comments