
Professor’s Comments March 22, 2015
Posted by OMS at March 22nd, 2015
Even though the Dow had a strong rally yesterday, it didn’t change the overall pattern or the wave count. It still appears that the markets are nearing completion of a wave 2 retracement.
As a matter of fact, there is a possibility that the wave 2 completed yesterday, but we’re going to have to wait until Monday to find out for sure.
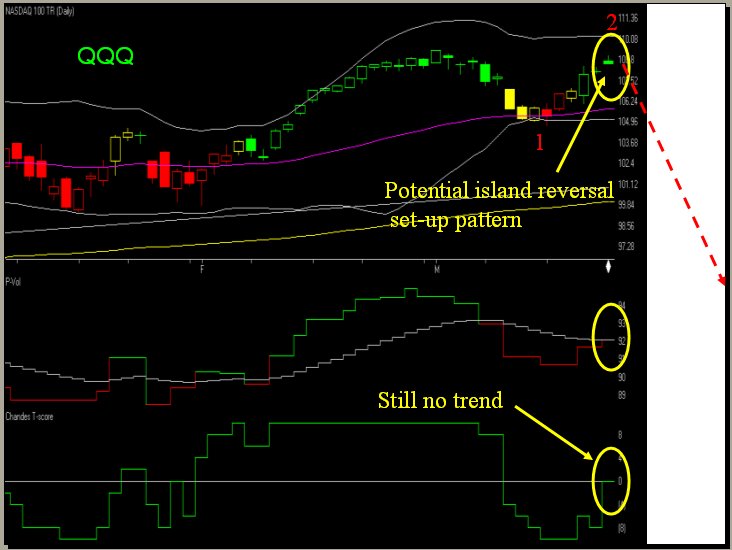
The reason I say this is because Friday’s gap open in the NASDAQ-100 (QQQ) followed by a lower close produced a pattern that is usually associated with Major tops. The fact that the Coach turned negative with this pattern lends further evidence. So we’ll have to see.
Going into next week, all of the markets are still below their 2 March highs, so until these highs are broken, my primary scenario still must be a wave 2 retracement.
Actually, even if the early March highs are exceeded, the overall pattern really doesn’t change much. If the high are broken it will likely mean that choppy waves of the wave 2 was actually part of a small Wedge Pattern for the final wave of the Major Ending Diagonal. The difference being that the Dow would top closer to 18,300+, and the time period for it to happen would be extended until early April.
However, for now, I’m still going with the wave 2 retracement scenario.
One of the things I have been watching for is downside follow through. In my Comments on Friday, I talked about a candlestick-topping pattern that had potential for a top. But as soon as the market opened on Friday, this set-up pattern was destroyed. There was NO downside follow through.
Here’s the thing: After a set-up, I need to see follow downside through. This is because I’m assuming that the current pattern is a wave 2, so the next wave down should be an impulsive wave 3. There should be lots of downside follow through. This is the key!
A normal wave 2 retracement always has several up-down-up-down moves that make up the individual waves of the pattern. The fact that we’re seeing all these 100-point moves now tends to confirm some type of retracement pattern. They are not usually associated with the start of a new Uptrend. So far, every rally leg has been followed by a pullback that was checked by another rally leg. One of these days, the pullback will NOT be checked. The selling will continue. There will be lots of downside follow through after the set-up, and that’s how wave 3 will start.
So once again, we have another set-up. Actually, there are several. Besides the island reversal set-up on the Q’s, there’s another on the S&P500. Because the SPY did not break above the 18 March high, the Harami set-up I talked about on Friday is still in place. There is also a problem with Apple (AAPL).
Apple had a tough day on Friday dropping 1.59 points while the Dow was rising 168. For the past 10 months, APPL has formed a classic THT pattern, reaching a top on 24 February. Since then, it appears that the first waves of a new downside Hockey Stick pattern have developed. And on Friday, Apple’s Money Flow indicator turned negative.
There was a lot of late selling in APPL on Friday that appeared to be institutional related. And now that AAPL is part of the Dow-30, it needs to be watched carefully because all three of the other computer technology related stocks in the Dow (INTC, MSFT, and IBM) are all in downtrends. So if Apple starts to falter, it would put pressure on all technology stocks, regardless if they were part of the Dow or listed on the OTC market. So watch APPL this week, especially on Monday. If the selling continues, it could turn the Daily PT indicators negative, which could mean that wave 3 down is starting for technology.
The final item I want to mention this weekend is that TLT and TMF are now on the Dean’s List. Remember, one of the things that I have been watching to signal a top in the equity markets is for money to start flowing into bonds. That is happening now. The PT indicators on both TLT and TMF are now Green. Also, both ETFs are now in Uptrends, so if you didn’t establish a Basic Position in Bonds when the indicators turned Green three days ago, remember you can still do it on the first pullback using a Rifle Trade. Conditions for Rifle Trades are now in place for Bonds. Keep your eye on the 2-period RSI Wilder and look for opportunities to add shares when the indicator becomes oversold.
Have a great weekend.
That’s what I’m doing,
h
| Market Signals for 03-23-2015 |
|
|---|---|
| DMI (DIA) | POS |
| DMI (QQQ) | POS |
| COACH (DIA) | POS |
| COACH (QQQ) | NEG |
| A/D OSC | |
| DEANs LIST | POS |
| THE TIDE | POS |
Not sure of the terminology we use? Check out these articles
The Hockey Stick Pattern
The Creation of Waves and Trends
FAQ
All of the commentary expressed in this site and any attachments are opinions of the author, subject to change, and provided for educational purposes only. Nothing in this commentary or any attachments should be considered as trading advice. Trading any financial instrument is RISKY and may result in loss of capital including loss of principal. Past performance is not indicative of future results. Always understand the RISK before you trade.

Category: Professor's Comments