
Professor’s Comments July 30, 2014
Posted by OMS at July 30th, 2014
The Dow rose early to 17,056 and then fell 144 points ending down 70 points, closing at 16,912. The large intra day decline was likely the Big Move predicted by the ‘relatively’ small change in the A-D Oscillator.
Volume was moderate on the decline, coming in at 105 percent of its 10 day average. There were 106 new highs and 50 new lows.
The SPX reached an intra day high of 1985 before finishing at 1970. If you look at the 60 min bars on the SPX, you can clearly see a five wave consolidation triangle pattern that has developed since 7 July. Yesterday’s decline appears to be the final ‘e’ wave of that pattern. If this is the case, then the market could start a small wave 5 rally out of this triangle pattern to test the 2000 level..
The fact that the Dean’s List remains positive, with the DIA, QQQ and SPY on the List, supports this analysis.
Also supporting a potential wave 5 rally is the fact that The Professor has not confirmed the recent negative DMI turn on the Dow. So without a clear sell signal from either the Dean or The Professor, its likely the markets will push slightly higher.
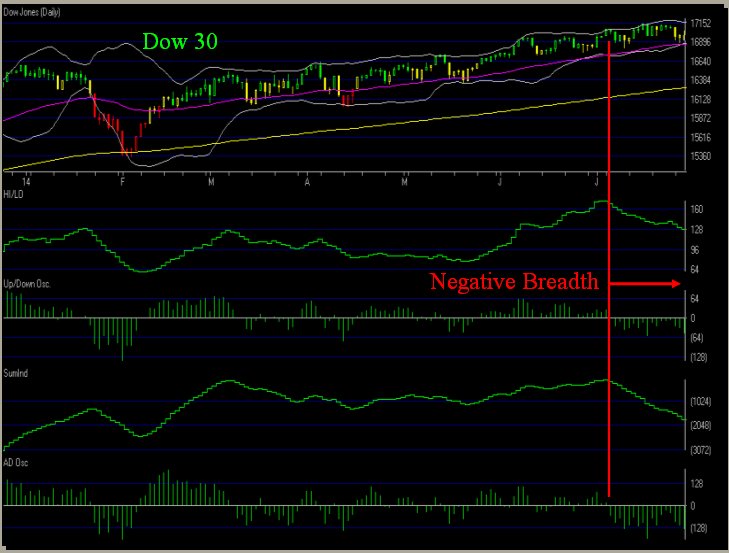
With the SPX at 1970, a potential move toward 2000 is only 30 S&P points or about 200-250 Dow points. I still believe that trades to the upside have limited potential, even from current levels which are down about 100 points from last week. Those 200+ points of upside potential are still not that attractive to me when weighed against a downside risk of 600-800 points Especially when all of the breadth indicators are still negative and heading down.
Yesterday’s late afternoon decline caused the A-D oscillator to become slightly oversold at -140.27. With a reading like this coming after the completion of a triangle pattern, it’s likely that the market will rally for the next few days. It will be very important to watch the internals during this rally, because once the pattern completes and the momentum starts to shift, the negative breadth that we have been watching will start to take over.
Watching breadth now will tell us a lot about how the market will react in the weeks ahead. If the breadth continues to break down on the rally, it will not only lead to the next down leg, but will have a significant impact on the next rally phase after the correction. On the other hand, if breadth starts to improve during the correction, it’s likely that the market will rally to new all time highs on the next leg up (IFit happens. Remember, there are no guarantees about the final legs in an Ending Diagonal Pattern. These patterns have a nasty habit of truncating. Any top reached in the days ahead could be the final top.)
But I’m getting ahead of myself. For now, let’s just watch how the market reacts during the likely wave 5 up. If breadth continues to deteriorate and the S&P gets closer to the 2000 level, I’ll start looking for shorting opportunities using TWM, DXD and QID. But first I need to see all of these ETFs on the Dean’s List. That’s not happening now.
After I finished posting today’s Comments, I looked at one of my competitor’s charts on breadth. I found it amazing! Amazingly wrong!
Now I don’t want to name names, but this very popular writer, has been showing breadth as negative since the beginning of April! Clearly this guy doesn’t know how to measure breadth.
I would agree that breadth was negative in April, but by late May, it started to turn positive. This led to a rally of over 500 Dow points into early July.
But since early July, breadth has turned negative. On 7 July, the date of the turn, the Dow was trading at 17,024. Now it’s at 16,912, a decline of about 100 Dow points.
This is why I believe that it is foolish to trade against breadth. And it’s also why it’s so important to measure breadth correctly.
I use four indicators to measure breadth, not one or two. One or two causes errors.
When all four of the indicators line up, it increases the odds that the market will move in the direction of the indicators. Then all I have to do is watch for the stocks I want to trade to appear on the Dean’s List and wait the PT indicators to trigger the trade.
Right now, breadth is negative, but the PT indicators are mixed.
This is why I’m just waiting.
That’s what I’m doing,
h
| Market Signals for 07-30-2014 |
|
|---|---|
| DMI (DIA) | NEG |
| DMI (QQQ) | POS |
| COACH (DIA) | NEG |
| COACH (QQQ) | POS |
| A/D OSC | |
| DEANs LIST | POS |
Not sure of the terminology we use? Check out these articles
The Hockey Stick Pattern
The Creation of Waves and Trends
FAQ
All of the commentary expressed in this site and any attachments are opinions of the author, subject to change, and provided for educational purposes only. Nothing in this commentary or any attachments should be considered as trading advice. Trading any financial instrument is RISKY and may result in loss of capital including loss of principal. Past performance is not indicative of future results. Always understand the RISK before you trade.

Category: Professor's Comments