
Weekend Strategy Review October 16, 2022
Posted by OMS at October 16th, 2022
The Dow rose 390 points early yesterday, a day after Thursday’s ‘Wild Ride’, and appeared to complete its wave 2 retracement pattern. Eight minutes after the open, the Dow reached a high of 30,428 which was just under the 5 October high of 30,454 and close enough to satisfy the requirement for a 3-3-5 wave 2 retracement. At 9:38 on the 4-minute bars, a Red Arrow appeared telling me that the spike rally was over and the next leg down of the Bear Market was starting. The Dow finished the day with a loss of 404 points, closing at 29,634. Order had been restored to the Bear Market.
Several weeks ago, I warned that the markets could see several sharp retracement rallies as it makes its way lower. These rallies occur when the market becomes EXTREMELY oversold and serve to relieve the oversold conditions. They tend to be much sharper than the rallies we see during Bull Markets, mostly because so many traders have large short positions, with a ton of margin, and are then forced to cover these positions when the PPT decides to start buy programs designed to support the market. The rallies are not fun to deal with if you’re short, but they are part of trading a Bear Market. This is one of the reasons I use two different accounts to trade my strategies: In my regular trading account, I’m always out of the market overnight s I don’t get caught in these rallies. And if I hold any longer-term positions in inverse ETFs, I hold them in my IRA. This way I never have all my trading money at risk if a short-covering rally begins.
Anyhow, after the rally scare of the past two days, it now appears that things are back on track for the next set of down waves to begin. The next decline should be a Wave 3 decline of multiple degrees. It should be a lot stronger than the last multiple 3 wave decline that occurred back in 2008. The reason I say this is because a good part of the 2007-2008 decline had already occurred in 2007. So, the 2008 decline (the crash wave) started from a much lower base. The current Wave 3 decline, which started on 16 August, was only 2,671 points from its 4 January high when it started. And because of this, it could easily exceed my near-term targets of 26,500 to 28,000 once it gets going. I still believe that that 24,000-25,000 is reachable, with 20,000 a long shot possibility.
Ok, this is the WSR, so I want to talk about strategy now. After all, the reason we trade is to make money. So, I want to show you exactly what I’m looking at now and what I will be doing in the days ahead if the market does what I expect.
The first thing I want you to look at is the Head & Shoulders Pattern that currently exists on the charts of all the indexes. Let’s use IWM, the ETF for the Russell 2K, as an example. On my chart, I have drawn a down sloping line connecting the 17 June lows (wave 1 lows) with the 30 September lows. The line does not have to be exact, just enough so you can see the right and left shoulders of the pattern. The ‘Head’ of the pattern is the 16 August top. So, if you measure the distance from the ‘Head’ to the neck line connecting the two shoulders, you get about 36 points. If you subtract those 36 points from the neck line, you should get a target near 130+/-. This will be my target for Wave 3 down once IWM starts to break below the current trend line near 163. That’s it. In other words, IF 163 is broken, I’ll look to trade TZA, the inverse EF for the RUT, to the upside until IWM gets close to the 130 level. BTW, the target for the inverse H&S pattern on TZA is near the 68+/- level. On Friday, TZA closed at 43.46.
If you plan to trade other inverse index ETFs, like SDOW and SQQ, during their Wave 3 declines, I suggest that you draw similar neck lines on their charts, so you can determine the targets for those ETFs as well. Then once you see the markets breaking below your trend lines and you start to see a bunch of Green Arrows on the inverse ETFs, you’ll know what to do.
That’s my strategy.
Last week, I said sub-wave 2 up needs to complete before the market starts to head significantly lower. After Friday’s action, sub-wave 2 now looks complete. So, the thing I’m watching now is a break of the trend lines.
The Dean’s List and the Tide are negative.
The Market Timing Indicators on all the major indexes are still negative.
The Sector Ratio came in at 4-20 negative after Friday’s session. The four strong sectors (if you can call zeros strong) were Energy (5), Real Estate (0), Cap Goods (0) and Insurance (0). The top five weak sectors were Semiconductors (-9), Telecoms (-7), Retail (-5), Consumer Products (-5) and Household Products (-5). Students should continue to note the RS of the weak sectors and how it compares to the RS of the strong sectors. The Sector Ratio is telling us that the overall market is extremely weak. state.
Bottom Line: Forget gold, silver, bonds, crypto and the dollar for now. Continue to focus on inverse index ETFs from the Dean’s List now that Wave 3 down could be ready to start. I still believe that inverse index ETFs are the Best Bet. Go draw your neck lines.
That’s what I’m doing,
h
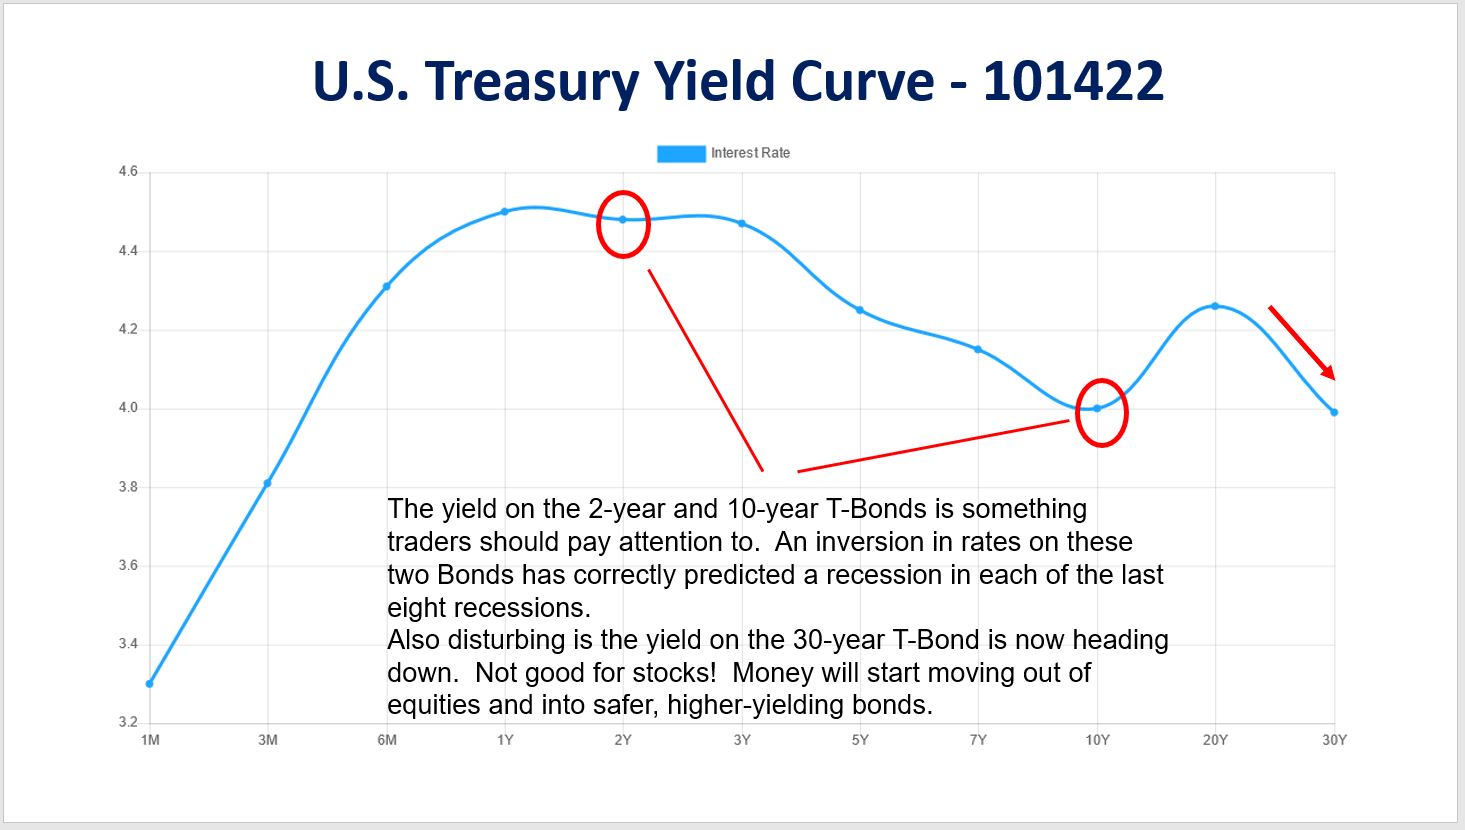
Attached is a chart of the U.S. Treasury Yield Curve you might wan to pay attention to.
It shows how the interest rate on the 2 and 10 year Bonds has inverted. The last eight times this happened in the past, the U.S. economy went into recession.
There are two things I have learned in my 55+ years of trading:
-
NEVER fight the Fed.
-
NEVER fight the yield curve when it inverts. NEVER!!.
Make sure you draw your H&S ‘necklines’ this weekend.
That’s what I’m doing.
h
Market Signals for
10-17-2022
| DMI (DIA) | NEG |
| DMI (QQQ) | NEG |
| A/D OSC | |
| DEANs LIST | NEG |
| THE TIDE | NEG |
| Index | Signal | Signal Date |
|---|---|---|
| DOW | NEG | 15 Sep 2022 |
| NASDAQ | NEG | 15 Sep 2022 |
| GOLD | NEG | 11 Oct 2022 |
| U.S. DOLLAR | POS | 07 Oct 2022 |
| BONDS | NEG | 11 Aug 2022 |
| CRUDE OIL | NEU | 12 Oct 2022 |
| CRYPTO | NEG | 07 Oct 2022 |
DISCLAIMER
As always, the Professor never makes recommendations. The information is provided on an educational basis so you can have informed discussions with your financial advisors and/or accountants about your individual investment decisions.
All of the commentary expressed in this site and any attachments are opinions of the author, subject to change, and provided for educational purposes only. Nothing in this commentary or any attachments should be considered as trading advice. Trading any financial instrument is RISKY and may result in loss of capital including loss of principal. Past performance is not indicative of future results. Always understand the RISK before you trade.

Category: Professor's Comments, Weekend Strategy Review