
Weekend Strategy Review May 30, 2015
Posted by OMS at May 30th, 2015
The Dow fell 115 points on Friday, closing at 18,011. It was down 221 points for the week. The decline caused the DMI on the weekly chart to turn negative. So now, not only is the DMI on the daily chart negative, it’s also negative on the longer term weekly chart.
Volume was heavy on Friday, coming in at 115 percent of its 10-day average. You never want to see heavy volume on a big down day if you’re Bullish.
Same for the number of new lows. On Friday the number of new lows exceeded the new highs by 62 to 56. So now the market is making more new lows than new highs. We haven’t seen that happen in awhile. Hmmm?
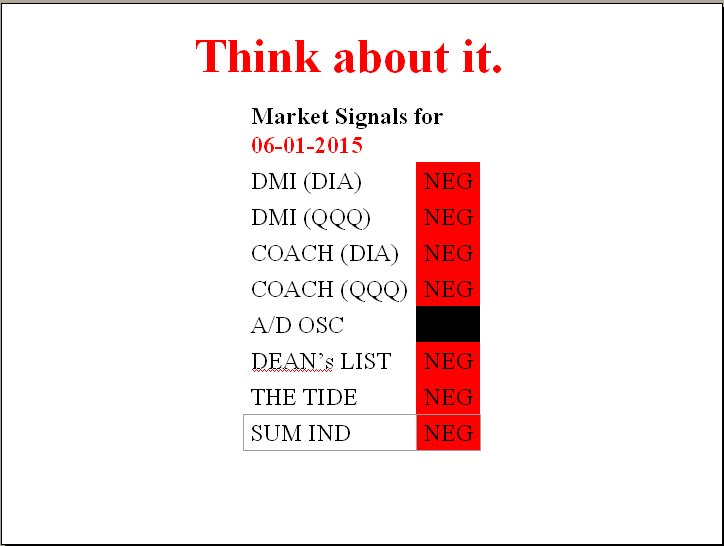
The other thing we haven’t seen in a while is a completely Red cockpit. For most of this year, as the Dow has been tracing out the final legs of its Ending Diagonal Pattern, the cockpit has been mixed. There were times when The Tide was Red, but the Dean’s List was positive. There were also times when one Coach was Red, but the other was Green.
Now, everything is Red.
This weekend, if you’re still long this market, you need to ask yourself why?
On Friday, the government reported that the GDP contracted during the first quarter of 2015 by 0.7 percent. I liked how they use the word “contracted” as opposed to showing a negative number. It was the worst first quarter reading since 1947 when the government started keeping records on GDP growth. If we get two contracting quarters in a row, the government will officially say we’re in a recession. They blamed the poor first quarter growth on the cold weather. Hmmm? Maybe they should think about this:
Since the government started keeping records, first quarter growth has ALWAYS been positive. Sometimes very positive. For example in the 1950s, under Truman, first quarter GDP grew at an annual rate of 16.9 percent. Under Eisenhower, it grew at an annual rate of 11.9 percent.
Under Johnson, GDP grew at 10.2 percent. Under Nixon, 11 percent. Under Ford, 9.3 percent. Under Reagan, GDP grew at a rate of 8.2 percent in 1984.
But since 1984, GDP growth has been slowing. There has not been a first quarter under any president, when GDP grew more than 5.0 percent. The closest it came was in the first quarter of 2006, when George W. Bush was president, and GDP growth hit 4.9 percent.
So if I accept the government’s cold weather theory, I have to believe that we haven’t had cold weather in January, February, and March for the past 30 years. Hmmm? Hey, I lived in D.C. back then and I can tell you for certain that it was cold during the winter. We had LOTS of cold weather, snow, sleet, and ice. And we still had positive GDP numbers for the first quarter.
The government is also saying that the poor growth numbers could be because of a poor model. Hmmm? Blame it on the model? But wasn’t this the same model that was used to calculate the positive numbers for the past 30 years? So just like social security, where they changed the model more than 20 times in the last 25 years to ‘tweek’ the CPI (so they can justify giving you less money for social security), now they want you to believe the model used to calculate GDP is broken. Hmmm? It worked for 30 years, but now its broken because it produced a negative growth number.
The government said the ‘contraction’ was a NEGATIVE 0.7 percent. Maybe…just maybe the reading is CORRECT and is due to something else? Maybe things are really not really as good at O says? Maybe that’s why all the cockpit indicators are RED.
Maybe?
Anyhow, do some thinking on this during the weekend. Most of you have been with me long enough to understand the risk of being in the market when an Ending Diagonal is the primary working pattern. You also understand what usually happens when the cockpit indicators turn RED. Things don’t usually end well.
This is the time when you need to be thinking about getting out of the valley and paying the six bucks commission to get back into the safety of the castle. You know the story. I talk about it in every Class. The lions, tigers, and bears are now entering the valley. The RED cockpit indicators are telling you that there is real danger ahead.
I’m not saying that the market is going to collapse next week. I’m NOT! The pattern still allows for one more push higher. If this happens this week, I’ll start looking to establish additional ‘trial’ short positions in the indexes.
However IF the Dow starts to generate downside momentum next week, I will have to change my tactics. If the Dow breaks 17,800, and the momentum starts to increase, I will take that as confirmation that the Bear Market has started. If 17,800 is broken, it means that the Dow topped on 20 May at 18,351, exactly as predicted. I want to be aggressively short this market below 17,800.
On Friday, I added a ‘trial ‘position in TWM, the inverse index ETF for the Russell 2K. Again, I’m still being cautious. The Money Flow indicator on the daily chart for TWM is still negative. If MF turns positive, I’ll become more aggressive.
Again, my primary strategy now that The Tide is negative, is to look for inverse index ETFs to buy as they appear on the Dean’s List. On Thursday the only inverse index ETFs on the List were the ETFs for the Russell. But now, all four of the inverse index ETFs are on the List. As long as they stay on the List, and The Tide remains negative, I will look for opportunities to add to my ‘trial’ positions.
Same for Bonds. TBT is still on the List, so I’m still not buying TMF or TLT. I’m just being patient.
I am still looking to add to my ‘trial’ positions in gold and silver. But I need to see more gold and silver move onto the Dean’s List.
The market is still in transition. We could still see some very choppy trading ahead. Don’t worry, you’re not missing the boat by being aggressively short. There will be lots of time for this later.
But now, after reading my Comments on GDP growth, and seeing those RED indicators, you should be asking yourself about why you’re still long? Remember, no stock, no matter how good, goes to heaven. Stocks go to targets. The Ending Diagonal Pattern, which is a TERMINATION Pattern, suggests a target near 18, 350+. The Dow has already hit 18,351.
And now the cockpit indicators are RED.
Think about it.
Have a great weekend.
That’s what I’m doing,
h
All of the commentary expressed in this site and any attachments are opinions of the author, subject to change, and provided for educational purposes only. Nothing in this commentary or any attachments should be considered as trading advice. Trading any financial instrument is RISKY and may result in loss of capital including loss of principal. Past performance is not indicative of future results. Always understand the RISK before you trade.

Category: Professor's Comments, Weekend Strategy Review