
Professor’s Comments October 31, 2014
Posted by OMS at October 31st, 2014
Yesterday’s 200-point rally in the Dow was very interesting when put under a microscope.
Early in the day, when the Dow up about 150 points, almost 130 of those points were attributed to one stock, Visa (V). Given its weight, Visa virtually carried the Dow higher by itself after reporting earnings. Volume was nearly 5-times the daily average of around 2.5 million shares. Visa’s high volume occurred on a day when the total volume on the NYSE came in at only 88 percent of its 10-day average vs. yesterday’s volume of 96 percent. So was the rally suspicious? You bet!
If you look at the actual numbers in Visa’s earnings announcement, they really weren’t all that great. For the period ending Sept. 30, Visa reported a profit of $1.07 billion, or $1.72 a share. This was DOWN from $1.19 billion, or $1.85 a year earlier. Revenue increased 8.6% to $3.23 billion which barely beat of consensus estimates of $3.19 billion. In other words, the increase was expected! The increase in revenue should have been factored into the price! Because earnings can be fudged, I’m always suspicious of a company’s earnings. I tend to focus on revenue. And when I see a relatively small increase in revenue driving Visa’s stock price up 21 points, I really get suspicious.
Also just after the open, when the Dow was up almost 150 points, both the NASDAQ and the broader S&P 500 were moving down significantly! But once the rally in the Dow kicked in, the it spread to the futures market which caused the other cash markets to reverse their losses. At the close, the Dow gained 221 points while the Nasdaq (QQQ) only gained 0.21 cents to 100.02. The 0.21 cent gain didn’t even make up for the previous day’s loss of 0.37 cents. So one must ask how this can happen? How can the Dow gain over 200 points on a day when the Nasdaq hardly moved? Could it be PPT tinkering? You be the judge.
Remember a few days ago, I talked about how the President’s PPT sometimes picks one or two stocks with a small float and then gooses the futures to start a rally? I’m not saying that this happened yesterday, but one has to wonder. It sure does make the incumbent party look good having the Dow trading back above 17,000 and approaching its old high going into a major election.
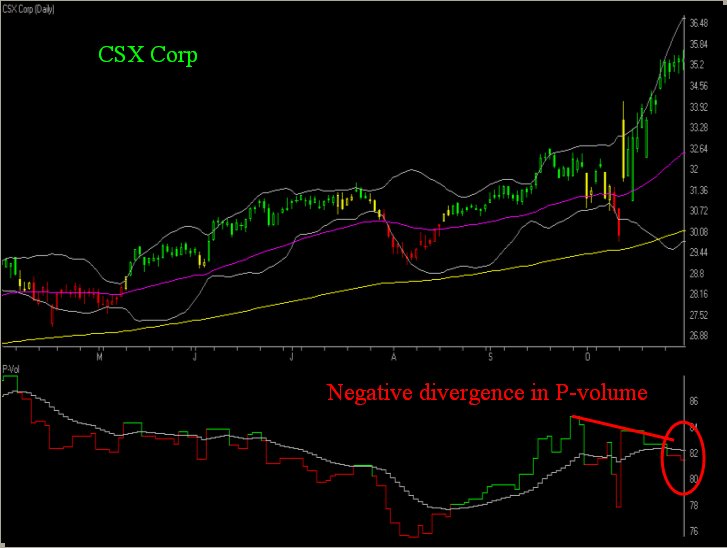
On the other hand, if you focused on the Dow Transports, DJT, they presented an entirely different picture. The transports actually had a pretty bad day and finished DOWN 84 points at 8,631. Because the DJT is an index and doesn’t have a P-volume associated with it, I’m posting a chart of CSX to show you the negative divergence in P-volume. The stock is NOT very healthy. The negative divergence in P-volume is warning that CSX could be ready to decline in the near future. I’m seeing similar divergence in most transports.
I’m mentioning the transports today because whenever they fall over 0.5% on a day when the DJI gains over 0.5%, it usually leads to short-term weakness in the overall market. But with an election only three trading days away, even this usually reliable tell becomes suspect.
Anyhow, yesterday’s big rally in the Dow really did not change anything with the overall Ending Diagonal Pattern. However it did raise the possibility that something else is going on.
I received and email from a student saying that he was becoming discouraged about the wave 2 scenario, and wondered at what point should he throw in the towel? Here’s what I told him:
“As I mentioned in my previous comments, it is allowable for a wave 2 to retrace all of wave 1. Most of the time, wave 2 retracements stop at 62 to 75 percent of wave 1. But under unusual circumstances, a full 100 percent retracement is possible. Given that a major election is scheduled for next Tuesday, it certainly could be considered an unusual circumstance.”
However after looking at yesterday’s trading action, it is possible that something else besides a wave 2 retracement is occurring. If yesterday’s rally was NOT part of a wave 2, then it is likely that the Ending Diagonal has NOT finished. It is possible that what appeared to be wave 1 down was actually wave ‘d’ down within the Ending Diagonal Pattern. In this scenario, the current rally wave would be considered wave ‘e’ up. This wave could take the Dow several hundred points higher, possibly to the 17,500 level, before completing.
With a positive Dean’s List, positive PT indicators, and an incoming Tide, the wave ‘e’ scenario currently has about the same odds as the wave 2 scenario. Another big rally day would tilt the odds in its favor.
The thing to keep in mind is that even if the Dow does rally to 17,500, the likely resolution of the larger Ending Diagonal Pattern has not changed. Skyrocket rallies NEVER end well. Once wave ‘e’ completes, the next sequence of down waves should be substantial. Remember too that ‘e’ waves in an Ending Diagonal Pattern can and do truncate, so there is NO guarantee that 17,500 will be reached. At this point, the only thing we know for sure is that the market is undergoing some very unusual trading.
Watching.
That’s what I’m doing,
h
| Market Signals for 10-31-2014 |
|
|---|---|
| DMI (DIA) | POS |
| DMI (QQQ) | POS |
| COACH (DIA) | POS |
| COACH (QQQ) | POS |
| A/D OSC | |
| DEANs LIST | POS |
| BREADTH | POS |
Not sure of the terminology we use? Check out these articles
The Hockey Stick Pattern
The Creation of Waves and Trends
FAQ
All of the commentary expressed in this site and any attachments are opinions of the author, subject to change, and provided for educational purposes only. Nothing in this commentary or any attachments should be considered as trading advice. Trading any financial instrument is RISKY and may result in loss of capital including loss of principal. Past performance is not indicative of future results. Always understand the RISK before you trade.

Category: Professor's Comments