
Professor’s Comments January 28, 2021
Posted by OMS at January 28th, 2021
The markets fell hard yesterday on heavy downside volume. After completing waves 1 down and retracement wave 2 up, the Dow gapped lower, breaking below its key 30,800 support level finishing the day 634 points lower at 30,303. The NASDAQ and SPX were also hit hard, losing 355and 99 points, respectively. Volume on the NYSE was heavy coming in at 180 percent of its 10-day average. This volume, over 10 Billion shares, was a record for the NYSE. The NASDAQ also broke a record with 11.5 Billion shares traded. This is NOT something you want to see on a Fed Day as heavy volume to the downside after a Fed announcement has usually led to lower prices during the next several weeks.
There were 118 new highs and 33 new lows. The number of new lows recorded was the highest level since 30 October. In previous updates, I have talked about the extremely low levels of new lows compared to new highs. Now those levels appear to be changing and have turned our composite breadth indicator, The Tide, negative.
Yesterday was a major change day in the markets. Remember, I have been on FULL RED ALERT. The reason is simple: Since reaching its high of 31,272 on 21 January, the Dow fell to a low of 30,564 on 25 January. The decline was accomplished in five waves down. At the time, I mentioned this because the low was the first lower low in many weeks. Lower lows are always something to note when Dow is in the final stage of an Ending Diagonal Pattern. As a said back then, it could be a sign that the Dow had put in a major top. From this lower low, the Dow then started a two day rally that carried it back to the 31,121 level. The important thing about the rally was that it took the form of a 3 wave a-b-c retracement. As most of you know from Class, a-b-c rallies after a 5 wave move down usually identify a wave 2. So, going into yesterday, the stage was set for a major wave 3 decline. Like I always say; If it looks, quacks, and waddles like a duck, ….it could be a duck. Another clue was that the Scalp Trading Volume on the Dow had turned negative on 21 January. If you took my ST Class, you know the importance of this indicator. All the clues were there.
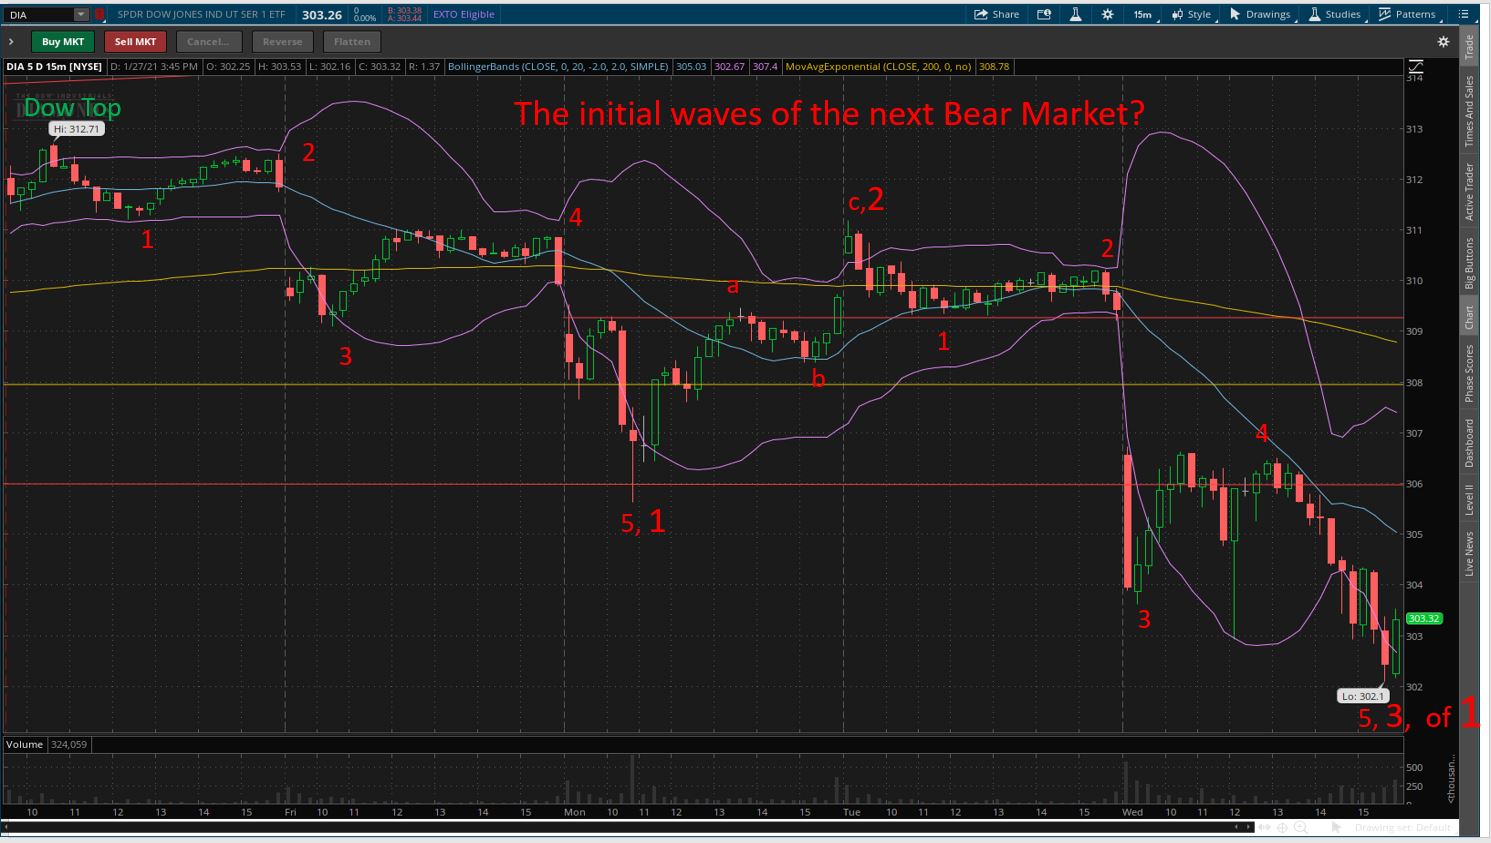
So, with this background, let’s take a closer look at what happened yesterday and see if we can tell what’s most likely going to happen next.
Yesterday’s decline was impulsive. So right away, we have another clue that wave 3 down is underway. Wave 3’s are always impulsive; that’s one of the easiest ways to identify them. The other way is the examine their wave structure…. they should have five distinct waves. Yesterday’s decline was accomplished in five distinct waves. You can easily see them on a 15 min chart. The decline stopped near the 30,207 level. In my earlier Comments, I projected an initial move down to the 30,000+ level. So, yesterday’s decline might have a few more points of decline to go before it begins to bounce. Once the bounce starts, it will signal the end of wave 1 down of a five wave sequence for wave 3 down. That’s right, the Bear Market is only beginning. My target for Major Wave 2 down is near the 26,144 level. That level is where the rally that produced the Ending Diagonal Pattern for Major Wave 5 up began. Beyond that is the 23 March low of 18,214. Remember, the rally off the 23 March low has now proved to be a Major Wave 5, making the March crash low Major Wave 4 down. This increases the probability that that March low will eventually be tested. This is the reason I believe that yesterday was a major change day for the markets. The impulsive nature of yesterday’s decline AND the overall pattern now suggest that wave 3 down of the Major Wave 1 down of the new Bear Market is now underway. Protect yourself.
The DMI on the Dow turned negative on 25 January. This was another clue that things are changing. Yesterday’s decline on the Dow (DIA) also caused the Market Timing Indicators AND the Scalp Trading Momentum Indicator to turn negative, generating a Sell Signal. The Market Timing Indicators on the NASDAQ have turned neutral.
The Dean’s List has turned Neutral. For the first time in weeks, DXD, the inverse ETF for the Dow, is back on the Dean’s List. All four breadth indicators that make up The Tide are now Negative.
The Sector Ratio fell to 20-4 Positive after yesterday’s session. The top 5 strong sectors are Insurance, Retail, Media, Service and Energy. The four weak sectors are Telecoms, Household Products, Transportation and Cap Goods. Continue to pay attention to the Sector Ratio this week. If it starts to turn negative, it will be a clear signal that the downside is gaining momentum.
Model Update: There were NO Changes to the Model. It remains 100 percent in cash.
Yesterday was another interesting day for many of the stocks in our Top Stock Rotation Strategy. If you needed convincing about just how good this strategy is for picking winners, just low at how two of the top stocks did during yesterday’s mini-crash. DDD, which had been #1 on the List, gained 5.04 points. It had been up over 7 points intraday. BBBY, which was #3 on the List, gained a whopping 16.02 points!!!!! Dillard’s, which was in the #2 position reached nosebleed territory when it was up over 20 points before falling back to the 95 level. Teradata, TDC, which was in the # 5 position was up over 4 points before its sky-rocket ride ended. Folks, this in truly unbelievable performance. During the day I spoke with several students who were trading CALL options on these stocks. They were all happy campers……on a day when the overall market was tanking!!!
Again…If you’re not trading my Top Stock Rotation Strategy with my new indicators, I don’t know what to tell you. Both sides of the new strategy, long and short, did well for me yesterday. I shorted CCL and RCL for big intraday gains yesterday. Yesterday was one of my best trading days ever as I made money with options, stocks, ETFs on both the long and short side. Like I keep saying, get the Class.
With the Dow (DIA) appearing to be either completing or nearing completion of wave 1 down, I will be looking for a bounce to put on a few more shorts. Some of the stocks from my ‘Weak List’ I’ll be looking to short on a bounce are #1 CDC, #2 HAL, #3 PAAS, and #4 CROX. I paid for another few cruises shorting CCL and RCL yesterday, and booked the gains, but now I’m going to wait for a bounce on these two before shorting again. CCL is now at the #17 position on the WL with RCL at #19. BTW, the two mining stocks I have been shorting are CDC and PAAS.
None of the mentioned stocks are recommendations. I don’t make recommendations. I just trade what I see on my Lists.
That’s what I’m doing,
h
Model Portfolio is being shown for educational purposed only. The Buy/Sell actions in the Model Portfolio are made based on technical indicators that can and do change frequently and should NOT be considered as recommendations for trading an actual portfolio. Any gain or loss in the Model Portfolio should not be used to predict future performance of the Model.
A FEW MORE COMMENTS:
In this mornings Comments, I forgot to mention the level where I expected the Dow would likely bounce to in wave 4 up. This is the level where I would start looking to short the market again. It’s hard to tell exactly where this level is, but for now, I’m going to use 30,600+/-. This might not be a good level for individual stocks, but if the Dow gets close to the 30,600 level, the next wave down after that should be a dozy, so I’m not particularly worried about being exact.
h
Market Signals for
01-28-2021
| DMI (DIA) | NEG |
| DMI (QQQ) | POS |
| A/D OSC | |
| DEANs LIST | NEU |
| THE TIDE | NEG |
| Index | Signal | Signal Date |
|---|---|---|
| DOW | NEG | 27 Jan 2021 |
| NASDAQ | NEU | 27 Jan 2021 |
| GOLD | NEG | 08 Jan 2021 |
| U.S. DOLLAR | POS | 27 Jan 2021 |
| BONDS | NEU | 27 Jan 2021 |
| CRUDE OIL | POS | 11 Nov 2020 |
Not sure of the terminology we use? Check out these articles
The Hockey Stick Pattern
The Creation of Waves and Trends
FAQ
All of the commentary expressed in this site and any attachments are opinions of the author, subject to change, and provided for educational purposes only. Nothing in this commentary or any attachments should be considered as trading advice. Trading any financial instrument is RISKY and may result in loss of capital including loss of principal. Past performance is not indicative of future results. Always understand the RISK before you trade.

Category: Professor's Comments