
Professor’s Comments February 28, 2017
Posted by OMS at February 28th, 2017
The Dow rose 16 points, closing at 18,837. Volume was moderate, coming in at 95 percent of its 10-day average. There were 171 new highs and 18 new lows.
Yesterday’s rally didn’t change the cockpit indicators much. The Hi-Lo indicator turned positive again, so now 3 of the 4 indicators that make up The Tide are positive. The lone holdout is the Up-Down oscillator. It remains negative.
It still appears that the market is approaching a significant top. The Shiller P/E ratio is now at 29.32. The mean for the ratio is 17.7. In other words, stocks are priced for perfection. But this is NOT a perfect environment.
Also, after watching the past few days of trading action, it appears that the Wave 4 correction might be even shallower than I thought. If you recall, I originally estimated the pullback to be about 200 points. But so far, the largest correction on the Dow has been an intraday decline of about 70 points. So, it’s possible that the Dow is correcting sideways, and will continue to rally into mid-March. This seems highly unlikely to me, but with the indicators so strong, it’s possible.
There is one other significant reason I believe the U.S markets will be topping in mid-March. If you look closely at the Dean’s List, you won’t see many of the European country ETFs on the List anymore. Germany (EWG) is the only European ETF on the List and has now moved down near the bottom. This tells me that European markets are starting to turn negative. Usually when this happens, the U.S markets aren’t too far behind. Also, my custom Money Flow indicators on EWJ (Japan), EWT (Taiwan), EWA (Australia) and FXI (China) have now turned negative.
Yesterday’s Sector Report showed 23 strong sectors and only one weak sector. The Semiconductors, Transports, and Banks continue to lead. The Service sector was the laggard
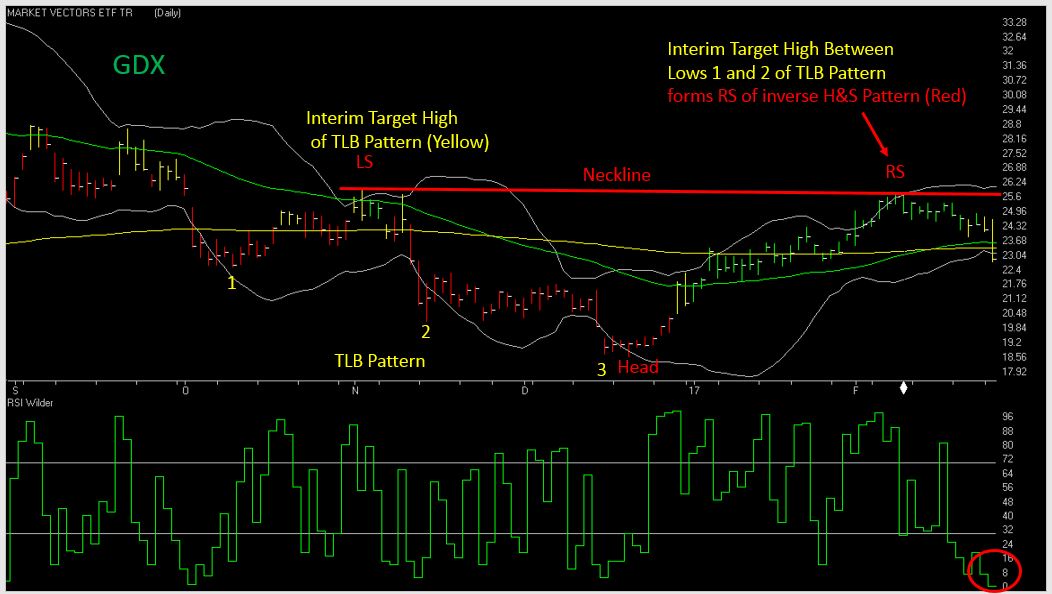
Gold fell slightly, but mining stocks had a tough day. GLD fell 0.58 cents to 119.12. The VTI on GLD continues to head up and remains in the Trend Mode at 86.3. GDX fell 1.29 points and even though its VTI is no longer in the Trend Mode, the 50 is still above the 200 and it’s 2-period RSI shows that it is EXTREMELY oversold. I will be watching the shorter-term bars today for a Rifle Trade bounce.
I would like to see the bounce take the ETF back above 23.55, to keep the 50 from slipping below the 200. The other reason I would like to see the ETF bounce today is because it’s possible that yesterday’s trading formed the right shoulder low of an inverse Head & Shoulder Pattern that started last October. The October low was 22.5. Yesterday’s low was 22.73. The neckline of the Pattern is near the 25.70 level. IF the Pattern continues to develop, and 25.70 is broken, it would project a target near the 32.3 level.
Students should ltake a quick look at the attached chart of GDX and note how the high between the first two lows of of the TLB Pattern served as the interim target for the TLB pattern. The interim target high (25.70) now serves as the neckline (resistance) for the new developing H&S Pattern which once broken should become support for the next move higher.
I’m still Bullish on gold, but as I mentioned yesterday, patience will be required to let the pattern develop and play out.
That’s what I’m doing,
h
Market Signals for
02-28-2017
| DMI (DIA) | POS |
| DMI (QQQ) | POS |
| COACH (DIA) | POS |
| COACH (QQQ) | POS |
| A/D OSC | |
| DEANs LIST | POS |
| THE TIDE | NEU |
| SUM IND | POS |
| VTI | POS-T |
One hour video recorded from May 28, 2016 The Professor’s Signs of a Major Market Turn – Prospectives and the Projected Timing and Levels One hour streaming video – includes webinar handouts The Professor usually holds an update class whenever the Market looks like it may be making a major turn. If you have been following the Professor’s Comments you know that a turn is due….. LEARN MORE
Not sure of the terminology we use? Check out these articles
The Hockey Stick Pattern
The Creation of Waves and Trends
FAQ
All of the commentary expressed in this site and any attachments are opinions of the author, subject to change, and provided for educational purposes only. Nothing in this commentary or any attachments should be considered as trading advice. Trading any financial instrument is RISKY and may result in loss of capital including loss of principal. Past performance is not indicative of future results. Always understand the RISK before you trade.

Category: Professor's Comments