
Weekend Strategy Review September 16, 2018
Posted by OMS at September 16th, 2018
With the Dow on a positive signal this weekend, I thought it might be a good idea to review a few charts to put things in perspective. But before we do this, lets review what happened during the week.
The Dow finished up 9 points on Friday, closing at 26,155. The large cap index was up 238 points for the week. The NASDAQ was down on Friday, but up 108 points for the week.
The Dow remains on its re-Buy Signal generated on 11 September. During the week, it also re-entered the Trend Mode. The NASDAQ moved from a Sell to a Neutral Signal as several of the large cap technology issues bounced from severe oversold conditions. It was a positive week for the U.S. indexes, but now let’s review the bigger picture.
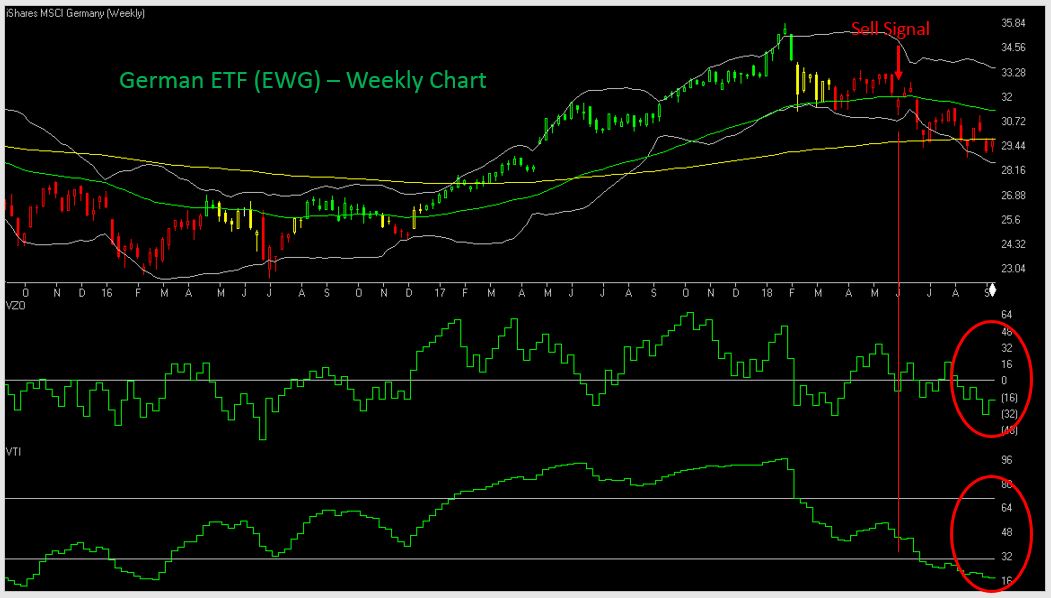
The first chart I want you to look at is the Weekly chart of EWG, the country ETF for Germany. Germany is the most important market in Europe, and when it goes negative, it usually spells trouble for the rest of Europe. And when the European economy starts to slow, that usually spells trouble for the U.S, as Europe is a large consumer of U.S. goods and services. This is the reason I always want to know what’s happening in Germany before I look at U.S. markets.
So, the first thing I see on the Weekly Chart of EWG is that the ETF topped in late January and has been on a steady decline ever since. Note how the VTI-volume indicator gave its first Sell Signal in early February which was followed by several other Sell Signals as the ETF moved lower. The most recent Sell Signal was generated in late June after which the ETF entered the negative Trend Mode. The take away from this is that Germany and most of Europe are now in Down Trends.
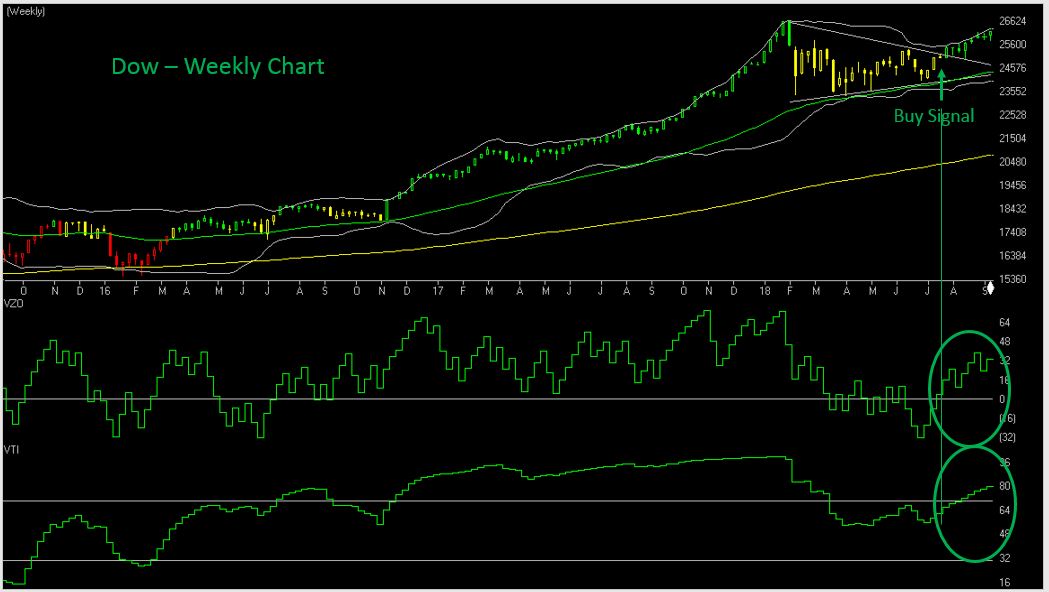
OK, so now let’s look at the Weekly chart of the Dow. As you can see, the Dow continues to Trend Up, with a positive VTI-volume indicator. The pattern suggests Major Wave 3 up completed in early January after which the large cap index went into a 5/12 month consolidation triangle for Major Wave 4. The index broke out of its triangle in mid-July and entered the Up Trend Mode in mid-August. I have been using the 26,600+ level as my target for months and I see no reason to change it this weekend. But given what I’m seeing in the charts of Europe, Canada, Australia, and other parts of the world, we need to pay attention to the indicators, because the deteriorating conditions in these world economies will start to impact the U.S. It’s not a question of maybe it will happen. It’s a question of when it will happen.
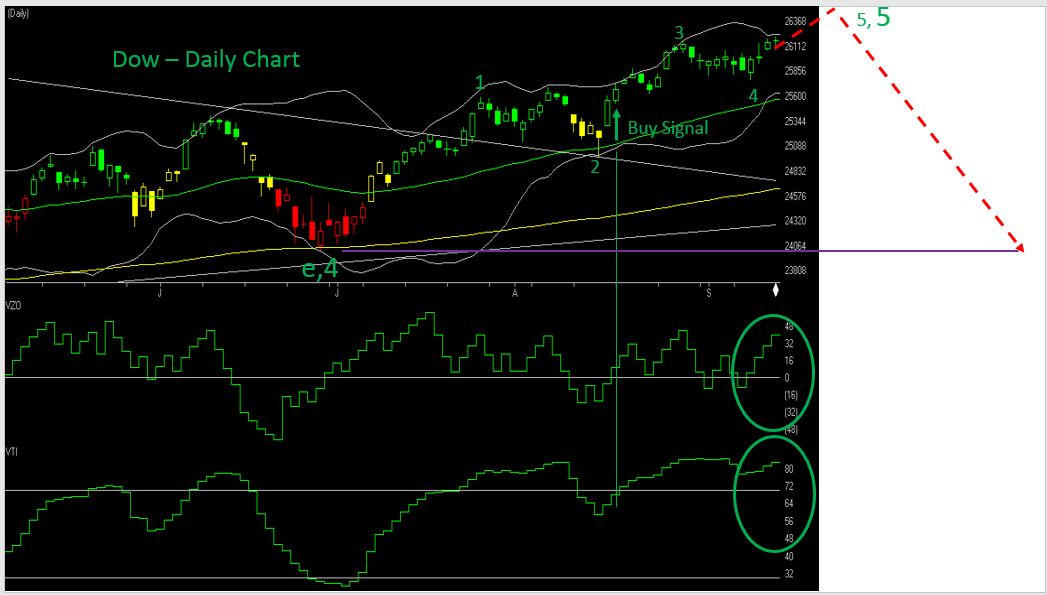
So now let’s look at the final chart which is a Daily Chart of the Dow. Again, it’s pretty east to see that the Dow is in a five wave pattern (an Ending Diagonal) that is nearing completion. The important thing to note is that the Dow entered this pattern after completing its Major Wave 4 triangle in late June. So, by completing the triangle, a pattern that almost always occurs in a Wave 4, we have a pretty good idea that Major Wave 5 up is underway. And by counting the Major Waves, we also know that the current wave 5 is the final wave of a five wave sequence of the Bull Market that started in March 2009.
So, with the economies of the world starting to weaken, and the wave count showing the end of the Bull Market is fast approaching, we need to be on our toes. We need to watch the indicators.
Right now, my primary market timing indicators are still looking good. But for the past two weeks, several of the breadth indicators have weakened considerably. In particular, the A-D oscillator has been negative since 4 September. This is NEVER a good sign when the Dow is moving higher. A negative A-D oscillator tells me that most stocks on the NYSE are moving LOWER, not higher. Same for the Hi-Lo indicator. It too is moving lower, meaning that most stocks on the NYSE are falling to new lows rather than rising to new highs. This tells me that the 30 stocks in the Dow are masking what’s happening in the broader market. The breadth of the market is narrowing. It’s something that typically happens when the market is approaching a major top as fewer and fewer stocks participate in the final rally.
I’m also seeing the same thing from a Sector perspective. During the week, the Sector Ratio slipped to 14-10 positive. The Strong List continues to be led by ‘defensive’ sectors like Transportation, Telecoms, PharmaBio, Household Products, FoodDrugs, and Cap Goods. Noticeable lacking on the Strong List are Technology, Semiconductors, and the Financials. Several of these ‘leading’ Sectors have now moved to the Weak List which is led by Energy, Semis, Service, Healthcare, and Banks. Students should continue to focus on the Top 5 Strong Sectors and avoid stocks in the Weak Sectors. If the market starts to roll over in the weeks ahead, the odds are high that stocks in the Weak Sectors, will lead the market lower even though most have already experienced significant declines.
What I’m telling you this weekend is to be careful with your stock selection and pay attention to the indicators. While I’m still expecting the Dow to push higher toward 26, 600+, there is a real and present danger that once the top is reached, the Ending Diagonal Pattern suggests it will fall below the 24,000 level. Also, Ending Diagonal Patterns can truncate and not reach their projected targets. There are no guarantees.
Again, be careful. Watch the indicators. This is NOT the time to be aggressive.
Have a great weekend.
That’s what I’m doing,
h
Market Signals for
09-17-2018
| DMI (DIA) | POS |
| DMI (QQQ) | POS |
| A/D OSC | SM CHG |
| DEANs LIST | POS |
| THE TIDE | POS |
| Index | Signal | Signal Date |
|---|---|---|
| DOW | POS | 11 Sep 2018 |
| NASDAQ | NEU | 13 Sep 2018 |
| GOLD | NEU | 14 Sep 2018 |
| U.S. DOLLAR | NEU | 14 Sep 2018 |
| BONDS | NEG-T | 05 Sep 2018 |
| CRUDE OIL | NEU | 13 Sep 2018 |
Only getting the Professor’s Weekend Review? Try his daily update Cum Laude service for 2 weeks only $9.99 LEARN MORE
All of the commentary expressed in this site and any attachments are opinions of the author, subject to change, and provided for educational purposes only. Nothing in this commentary or any attachments should be considered as trading advice. Trading any financial instrument is RISKY and may result in loss of capital including loss of principal. Past performance is not indicative of future results. Always understand the RISK before you trade.

Category: Professor's Comments, Weekend Strategy Review