
Weekend Strategy Review May 26, 2019
Posted by OMS at May 26th, 2019
There are two things I want to discuss in this weekend’s WSR: Longer Term Strategy and the Model.
From a strategy perspective, the market still appears to be working on wave ’c’ down of Wave B down. If I’m correct about this, Wave ‘B’ down should complete somewhere close to the 25,000 to 25,200 level and then begin to rally into the fall. The Dow could make new all-time highs during the rally. All this assumes that the 25,000 level holds during the next few weeks. If it doesn’t, 24,000 or lower is likely.
The patterns and indicators are not giving us much help at this point, and with the Dow closing at 25,586 on Friday, this is clearly NOT the time to get aggressive. Besides, the current market is being driven by and Presidential tweets and news events, and not earnings. This has made the month of May an extremely volatile month for the markets. I don’t expect this choppy trading will lessen until the trade issues with China are resolved, which by the way, should happen. The reason I say this is because the Chinese tariffs are mostly impacting our farmers, and not the average U.S consumer. And I believe that without the support of farmers and the farm states, President Trump loses the 2020 election. So there is a strong incentive for the President to get these trade issues resolved. Then once they are put to bed, the markets should settle down and begin to respond to earnings again.
Speaking of earnings, the first quarter results were good for most large S&P500 companies, up an average 2.2%. However, the guidance provided by many of these same companies was less than expected. This could put a damper on the markets going forward. Also, the share buyback programs that I talked about in previous WSRs, which helped boost stock prices of large companies for the past year and a half, continued last quarter but will begin to taper off as we head into the fall. Without these buybacks, unless earnings really pick up, the market could experience some serious headwinds. In other words, the fundamentals are beginning to line up with what the longer-term patterns suggest….that the markets could be in for a serious decline once we move past the fall.
BTW, I keep talking about the fall. But let’s NOT forget that IF the Dow holds the 25,000-25, 200 level during the next few weeks, there’s a really good possibility that it could rally to new highs later this year. I’m still NOT seeing a lot of institutional selling, so let’s not get too negative. June could still be a rough month, but once we move into late June-early July, the fireworks could start. As you know from my Classes, the end of month period going into the 4th of July is usually a very positive time for the markets. So, IF the indicators begin to turn positive, both the pattern which suggests a final Wave ‘C’ up is required to complete the pattern, AND the indicators could line up in support of a rally. That’s about the time I would expect the Sector Ratio to turn positive. If it does, we could be off to the races.
Right now, at 17-7 negative, the Sector Ratio is still too weak for a rally. So I have a tough time even thinking about the long side now. What I’m saying is …be patient. The Strong List continues to be led by Real Estate, Household Produces, Insurance, Telecoms and Foods. All defensive sectors. This is NOT the List you want to see if you’re Bullish on the markets. The Weak Sector List continues to be led by Service, Energy, Material, Retail, and Semiconductors.
There were NO CHANGES to my market timing indicators after yesterday’s session. The NASDAQ and Russell 2K remain on Sell Signals. The Dow and SPX remain on Neutral Signals. So, with mixed signals I remain cautious with my positions. It still appears that the markets are in some type of corrective mode with NO Trend in place. Whenever there is NO Trend in place, we trade smaller positions and take profits quickly. That’s what I did this past week.
The Tide and the Dean’s List are negative. The DMIs remain Negative.
Model Portfolio: The Model bought 500 shares of DXD and QID early in Friday’s session at prices of 28.80 and 34.34 per share. The Model Portfolio’s cash balance is now $79,169. The Model is still void of gold, and looking for an opportunity to re-enter the inverse crude oil trade. It’s in no hurry to do either.
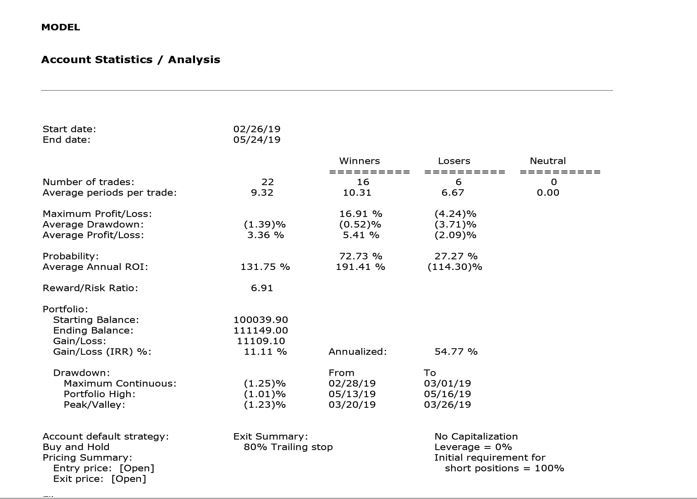
Since inception, the Model has gained 11.11 percent which translates to an annualized return of 54.77 percent. This compares to a gain of 1.49 percent for the SPX for the same period. The Model continues to hold its own against the SPX, even though the conditions the Model was designed to take advantage of (a trending market) have not occurred to date.
Other statistical-performance measures for the Model are shown on the attachments. You might want to take some time this weekend and look at these statistical measures and compare them with the information your broker or financial advisor is providing you. Also, you might want to compare this information with that being provided by some of the more popular newsletter writers, who are charging you big bucks for their info. If you’re a subscriber to some of these newsletters, you probably know that many of their stocks got waked recently, especially the China stocks that many of them were in. For instance, XLNX was a top recommendation in one of these newsletters. It dropped from 141 to 102. Another was UBNT, which dropped from 172 to 126. Both stocks are still being touted. Hmmm? I wouldn’t be able to sleep nights if I provided this type of information to my students! But they don’t care. They just move on and give you a few new recommendations. It’s almost criminal! Anyhow, take a good look at the Model’s statistics and see how we’re doing.
The Model Portfolio is being shown for educational purposed only. The Buy/Sell actions in the Model Portfolio are made based on technical indicators that can and do change frequently and should NOT be considered as recommendations for trading an actual portfolio. Any gain or loss in the Model Portfolio should not be used to predict future performance of the Model.
Have a great weekend.
That’s what I’m doing,
h
U.S. Markets will be closed on Monday, 27 May, for the Memorial Day Holiday.

Market Signals for
05-28-2019
| DMI (DIA) | NEG |
| DMI (QQQ) | NEG |
| A/D OSC | |
| DEANs LIST | NEG |
| THE TIDE | NEG |
| Index | Signal | Signal Date |
|---|---|---|
| DOW | NEU | 10 May 2019 |
| NASDAQ | NEG | 20 May 2019 |
| GOLD | NEU | 23 May 2019 |
| U.S. DOLLAR | POS | 16 May 2019 |
| BONDS | POS | 23 May 2019 |
| CRUDE OIL | NEG | 23 May 2019 |
Only getting the Professor’s Weekend Review? Try his daily update Cum Laude service for 2 weeks only $9.99 LEARN MORE
All of the commentary expressed in this site and any attachments are opinions of the author, subject to change, and provided for educational purposes only. Nothing in this commentary or any attachments should be considered as trading advice. Trading any financial instrument is RISKY and may result in loss of capital including loss of principal. Past performance is not indicative of future results. Always understand the RISK before you trade.

Category: Professor's Comments, Weekend Strategy Review