
Weekend Strategy Review June 9, 2019
Posted by OMS at June 9th, 2019
he markets rallied hard on Friday after the BLS announced that only 75,000 new jobs were created in May. The decline was the second time in four months that payrolls increased by less than 100,000. Most economists were expecting a gain of 180,000 new jobs, so the ‘experts’ really blew it.
The BLS also announced substantial downward revisions to the two previous month’s report. The March jobs number fell from 189,000 to 153,000 and the April number reduced from 263,000 to 224,000. So, the total two month reduction was 75,000 jobs.
When I look at the numbers, they are telling me one thing…. the economy is slowing.
However, a slowing economy does not mean that the stock markets will falter immediately. The current rally began from EXTREME oversold conditions. Friday’s weak jobs report added fuel to the rally, as investors believe the Fed will now lower interest rates at its next meeting on 18-19 June. Once Friday’s rally began, the shorts started covering resulting in a gain of 263 points on the Dow. The Dow reached a high of 26,073 before closing at 25,983.
OK, so where does this leave us now? Is the pattern any clearer after Friday’s rally?
The simple answer is NO. After Friday’s rally, the 2-period RSI on the Dow is showing an oversold reading of 97.09 with the CCI at 9.67. In other words, the Dow is EXTREMELY overbought now with NO TREND in place. It should begin to pull back.
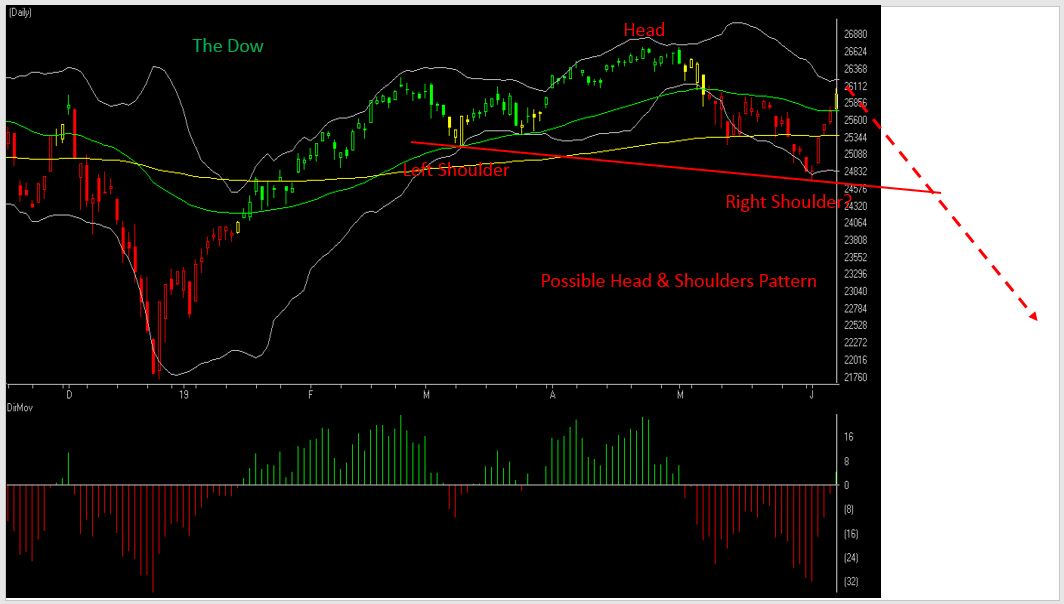
And, IF it begins to pull back next week, the decline could still form the right shoulder of a large Head and Shoulders topping pattern. I have attached a chart of the Dow that shows this potential H&S pattern. The reason I remain cautious and continue to monitor this pattern is because almost any ‘news’ event could trigger this pattern and the result would be a devastating loss for my students. It’s not as if the current economic / political situation in the world is rosy. It’s not. Who knows what will happen with China, N. Korea, Iran, Israel, the mid-east, and Brexit, not to mention what’s happening with the new tariffs in Mexico? If any one of these situations begin to erupt, it could cause significant damage to the equity markets. Remember, the trade issues with China alone caused the Dow to decline over 2,000 points in May. These issues have not gone away. China continues to dig in and the issues with trade don’t appear to be any closer to being resolved than they were a month ago. Only now, because of the current relief rally, the Dow is 1,000 points higher.
Let’s talk about the rally for a minute. As the May decline started, my top scenario was that the decline was a Wave ‘B’ within an A-B-C structure. I mentioned several times that because my Money Flow and breadth indicators showed that money was not leaving the market, I did not feel that the May decline was anything but a correction in an overheated market. I felt that once the correction completed, the market would begin to rally, which it did.
But now that the rally has occurred, the question is ‘how high will Wave ‘C’ up take it? Will Wave ‘C’ up make new highs? It’s possible. But it’s also just as likely that Wave ‘C’ up could truncate and terminate at any time. Remember, it’s NOT like we’re dealing with the initial stages of a Bull Market. No! This is a tired Bull, nearing completion. The pattern leading up to the May high was an Ending Diagonal…a termination pattern. This pattern was broken during the May decline to 24,680. A broken Ending Diagonal has a target of where the pattern began, or in this case it’s the 26 December 2018 low of 21,713.
So, when I see a potential Head & Shoulders pattern developing with a target similar to that of the Ending Diagonal, I start to become very concerned. It changes my focus. I’m no longer concerned about how high the Dow could go on the current rally. Those possible 1,000 points or so to the upside won’t mean much if we get this wrong and suddenly the Dow begins to drop 600 to 1,000 point in a day. That’s what I’m worried about now…not the potential upside gain. Remember, the May decline took out the 11 March low, so the market is now marking new lower lows, not new highs. We’re not even close to making a new high on the Dow which is what we need to see to confirm the Bullish case. The recent rally has caused a lot of investors to forget this. I’m not one of them. The recent rally has only recovered about half of the May decline. In other words, it could be a normal 50 percent retracement.
So next week, the safest place to be is on the sidelines…watching. If the markets begin to pull back, the odds will begin to shift in favor of the H&S scenario. Besides, even if I’m wrong about the H&S Pattern, the market is way too overbought at this point for me to jump in. Remember, if it turns out that the pattern is really a Wave ‘C’ up, and the Dow is headed toward 27,000, there will be pullbacks along the way that should provide better (safer) entry points.
So be patient.
There were no changes to my market timing indicators after Friday’s session. The Dow and Russell 2K remain on Buy Signals. The NASDAQ and SPX remain on Neutral Signals.
The Sector Ratio strengthened to 14-10 negative after Friday’s session. Most sectors are still not participating in the rally. I’d still like to see the Ratio turn Neutral to Positive before getting aggressive on the long side. The Strong List continues to be led by Real Estate, Household Products, Insurance, Financials, and Telecoms. Except for the Financials, these are all defensive sectors…not the sectors that usually lead a market rally. The Weak Sector List continues to be led by Service, Energy, Retail, Transportation, and PharmaBio.
Model Portfolio: There were NO CHANGES to the Model after yesterday’s session. The Model remains 100 percent in cash ($113,649).
Gold and most mining stocks rose yesterday. Gold (GLD) remains overbought with a 2-period RSI of 99.83. One thing I did notice yesterday was that money has begun to flow out of gold (GLD), so gold could have reached a short-term top on Friday. The Model continues to look for an opportunity to buy gold at a reasonable price. Buying gold…or anything else when the 2-period RSI is at 99.83 is usually not a good idea.
The Model Portfolio is being shown for educational purposed only. The Buy/Sell actions in the Model Portfolio are made based on technical indicators that can and do change frequently and should NOT be considered as recommendations for trading an actual portfolio. Any gain or loss in the Model Portfolio should not be used to predict future performance of the Model.
Have a great weekend.
That’s what I’m doing,
h
Market Signals for
06-10-2019
| DMI (DIA) | POS |
| DMI (QQQ) | NEG |
| A/D OSC | |
| DEANs LIST | NEU |
| THE TIDE | POS |
| Index | Signal | Signal Date |
|---|---|---|
| DOW | POS | 05 Jun 2019 |
| NASDAQ | NEU | 06 Jun 2019 |
| GOLD | POS | 03 Jun 2019 |
| U.S. DOLLAR | NEG | 03 Jun 2019 |
| BONDS | POS | 23 May 2019 |
| CRUDE OIL | NEG | 23 May 2019 |
Only getting the Professor’s Weekend Review? Try his daily update Cum Laude service for 2 weeks only $9.99 LEARN MORE
All of the commentary expressed in this site and any attachments are opinions of the author, subject to change, and provided for educational purposes only. Nothing in this commentary or any attachments should be considered as trading advice. Trading any financial instrument is RISKY and may result in loss of capital including loss of principal. Past performance is not indicative of future results. Always understand the RISK before you trade.

Category: Professor's Comments, Weekend Strategy Review