
Weekend Strategy Review June 2, 2019
Posted by OMS at June 2nd, 2019
The markets were hit hard on Friday after President Trump announced that the U.S. would impose a 5 percent tariff on Mexican goods starting on 10 June. The Dow finished the day down 355 points, closing at 24,815. It was down 771 points for the week. The NASDAQ finished down 115 points on Friday and was down 183 points for the week. It was the sixth consecutive week that the Dow has lost money.
Yesterday’s decline broke through the ‘Neckline’ on the Dow at 25,000. So, because of this, it’s likely that the Dow will continue to decline to the 24,000 level, possibly lower. However, while the H&S pattern suggests lower prices, it’s also likely that the decline will NOT be straight down. There should be rallies along the way. This is because the current decline still appears to be part of a wave ‘c’ down within a Wave ‘B’ down. IF this is the case, once Wave ‘B’ down completes, it’s still possible that the market will rally into the fall to complete Wave ‘C’ up.
In other words, the current pattern continues to suggest that the Dow is in a corrective wave and NOT the beginning of a new trend. And anytime a correction is underway, students should expect to see choppy, volatile trading. This is the reason why I continue to trade small ‘trial’ positions and take profits quickly. This is how I trade non-trending markets. And until the overall pattern suggests that a new trend is in place, this is what I will continue to do.
Another thing I do is pay attention to the Sector Ratio. The Ratio is one of the best tools I know of for identifying major trends. It’s so simple! All you must do is look at the Ratio and if its negative, you immediately know that more sectors are moving down than moving up. If you’re long when the Ratio is negative, you’re bucking the tide. It’s tough to make money when you continually fight the market. No! The easier way is to go with the flow. That’s exactly what we started to do back in early May when the Ratio started to weaken.
For example, on 3 May the Ratio was still 13-11 positive. The ratio was strong during April, but by early May it was started to weaken. Then on 7 May, the Ratio turned negative. Back then, the Dow was trading near the 26,000 level. The Weakest Sectors were Service, Energy, Healthcare, and Material (includes gold). An Energy Stock, like HAL fell from 27 to 21. DIG, the Oil and Gas ETF fell from 28.5 to 23.86. A Healthcare stock like CAH, dropped from 49 to 42. So not only did the Sector Ratio tell you the market was heading down, it also told you which sectors would lead the way down.
Let’s go back to early January and look at what happened then when the Sector Ratio turned positive. Remember, going into January, the Dow was having a tough time of it. The large cap index was still recovering from the October decline (or rout!). On 7 January, when my market timing signal for the Dow turned positive, the Sector Ratio was beginning to turn neutral. The Dow was at 23,531. By mid-January, the Ratio was at 14-10 positive, confirming the timing signals. Consumer Products was the strongest Sector. Stocks like Nike (NKE) went from 77 to 89 in two months. By 25 January, the market was rolling, and new leaders started to appear. The Sector Ratio improved to 17-7 positive and Semiconductors were at the top of the Strong List. Intel (INTC) went from 48 to just shy of 60. Micron (MU) went from 34 to 44. Again, the Sector Ratio told you what the market was doing (going up) and which sectors would lead the way higher.
OK, so what’s the Sector Ratio telling us now? Hmmm? Well, with the Ratio at 18-6 negative, it’s hard to get excited about the long side. Yeah, I hear all those commentators on CNBC saying, “it’s a good time to buy”, but I’ve heard them say this before…like during the start of the 2001-2002 and the 2007-2008 crashes. No, you won’t see me buying until I see the market timing indicators and Sector Ratio turn positive. I’ve learned to ignore these so called ‘market experts’ and let the market tell me what it wants to do. Before I turn positive, I want to see most sectors moving up. Right now, with a Ratio at 18-6 negative, most sectors are moving down! And if more sectors are moving down than up, I will continue to trade…notice the use of the word ‘trade’, the south side. We’re currently in a corrective, news driven cycle. So be quick like a cat…keep positions small and take profits quickly.
There were NO Changes to the market timing signals for equities. The Dow, SPX, NASDAQ, and Russell 2K remain on Sell Signals.
The Tide and the Dean’s List remain negative. The DMIs remain Negative. The Money Flow indicators are negative. However, the markets are EXTREMELY oversold, so they can bounce at any time. The Dow has now had consecutive days with A-D oscillator readings below -123. This usually results in a bounce.
As I said above, the Sector Ratio was at 18-6 negative after yesterday’s session. The Strong List continues to be led by Real Estate, Household Produces, Insurance, Telecoms and Financials. This is NOT the List you want to see if you’re Bullish on the markets. The Weak Sector List was led by Service, Energy, Retail, Consumer Products and Autos.
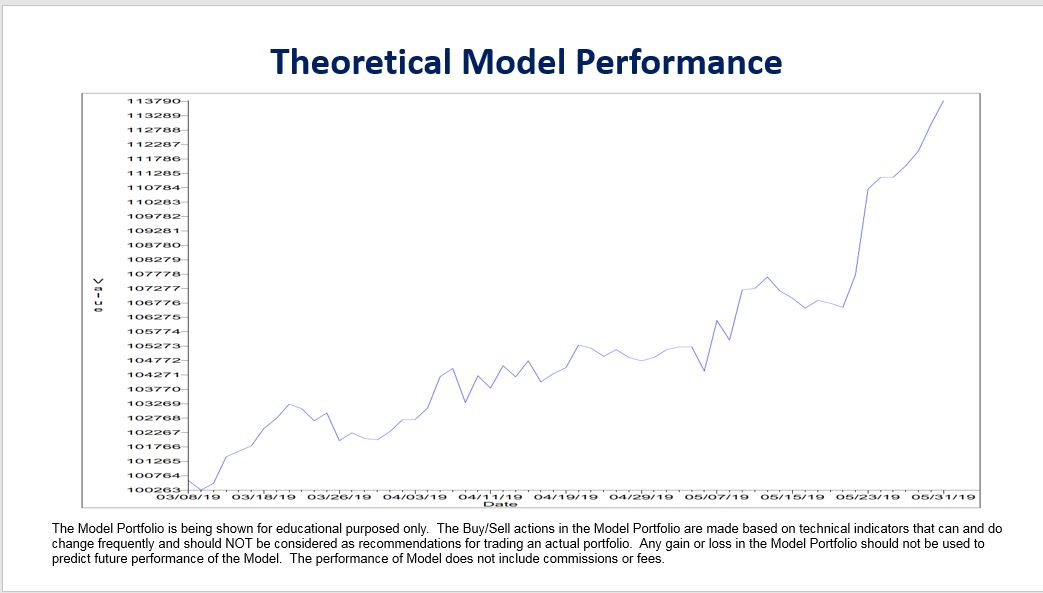
Model Portfolio: About a half hour after the market opened, the Model once again sold its two inverse positions in DXD and QID, for a nice profit. So, going into the Weekend, the Model is 100 percent in cash ($113,814). Isn’t it nice to be sitting safely in cash while the markets are trying to sort out crisis after crisis and experiencing extreme turmoil? BTW, IF the market bounces early next week, the Model will look to re-establish its inverse positions.
Since inception, the Model has gained 13.77 percent, which translates into an annualized IRR of 64.15 percent. During the same period, a buy and hold strategy for the SPX has gained 0.11 percent. So far, the Model has made 25 trades: 19 winners and 6 losers. The Model continues to hold its own against the SPX even though the conditions the Model was designed to take advantage of (a trending Market) have not occurred to date. An equity chart for the Model is attached.
The Model Portfolio is being shown for educational purposed only. The Buy/Sell actions in the Model Portfolio are made based on technical indicators that can and do change frequently and should NOT be considered as recommendations for trading an actual portfolio. Any gain or loss in the Model Portfolio should not be used to predict future performance of the Model.
Have a great weekend.
That’s what I’m doing,
h
Market Signals for
06-03-2019
| DMI (DIA) | NEG |
| DMI (QQQ) | NEG |
| A/D OSC | |
| DEANs LIST | NEG |
| THE TIDE | NEG |
| Index | Signal | Signal Date |
|---|---|---|
| DOW | NEG | 28 May 2019 |
| NASDAQ | NEG | 20 May 2019 |
| GOLD | NEU | 23 May 2019 |
| U.S. DOLLAR | POS | 16 May 2019 |
| BONDS | POS | 23 May 2019 |
| CRUDE OIL | NEG | 23 May 2019 |
Only getting the Professor’s Weekend Review? Try his daily update Cum Laude service for 2 weeks only $9.99 LEARN MORE
All of the commentary expressed in this site and any attachments are opinions of the author, subject to change, and provided for educational purposes only. Nothing in this commentary or any attachments should be considered as trading advice. Trading any financial instrument is RISKY and may result in loss of capital including loss of principal. Past performance is not indicative of future results. Always understand the RISK before you trade.

Category: Professor's Comments, Weekend Strategy Review