
Weekend Strategy Review June 16, 2019
Posted by OMS at June 16th, 2019
The markets pulled mildly back yesterday. The Dow finished with a loss of 17 points, closing at 26,090. The Dow was up 106 points on the week. The NASDAQ was down 40 points on Friday, but up 54 points for the week.
There were NO Changes to the market timing indicators for equities after yesterday’s session. The Dow, NASDAQ, SPX, and Russell 2K remain on Buy Signals. However, the volume position of my VTI-volume indicator on the Dow has been declining this past week and is now at the point where it is close to turning negative. This is something that needs to be watched loosely as we move into next week.
BTW, the volume portion of my VTI-volume indicator on the Weekly Chart of the Dow remains negative. It turned negative on 3 May and remains negative this weekend. This Weekly indicator is a very good indicator for determining longer-term trends. Its one of the reasons I remain cautious about the long side.
Yesterday’s decline DID NOT do anything to change the overall patterns. The Head Shoulders Pattern that has been developing on the Dow for the past several weeks is still very much in play. A decline below the 3 June low of 24,680 would confirm the pattern. IF the pattern is confirmed, the target for the Dow is the 26 Dec 2018 low of 21,713. Otherwise, IF the market timing indicators remain positive, the Dow should continue to push higher. Just remember, that the markets are in termination patterns that can end at any time. This is NOT the time to be aggressive!
The Tide, Dean’s List, and DMIs remain positive. The Money Flow indicator on the Dow remains negative, while the same indicator on the NASDAQ remains slightly positive.
The Sector Ratio stayed at 12-12 Neutral after Friday’s session. Five of the sectors on the Strong List still have RS Ratings of zero or 1, so the List is still not very strong. If the market starts to decline, all these sectors will likely drop off the Strong List turning the Sector Ratio negative again. The Strong Sector List was led by Household Products, Real Estate, Insurance, Food Drugs, and Telecoms. The Weak Sector List was led by Service, Energy, Retail, Utilities and Semiconductors.
Model Portfolio: Late yesterday, when gold pulled back, the Model purchased 500 shares of GDX, an ETF for the gold miners. So, now the Model is over weighted in gold related shares holding 500 shares of UGL and 250 shares of NUGT in addition to the 500 shares of GDX it bought yesterday.
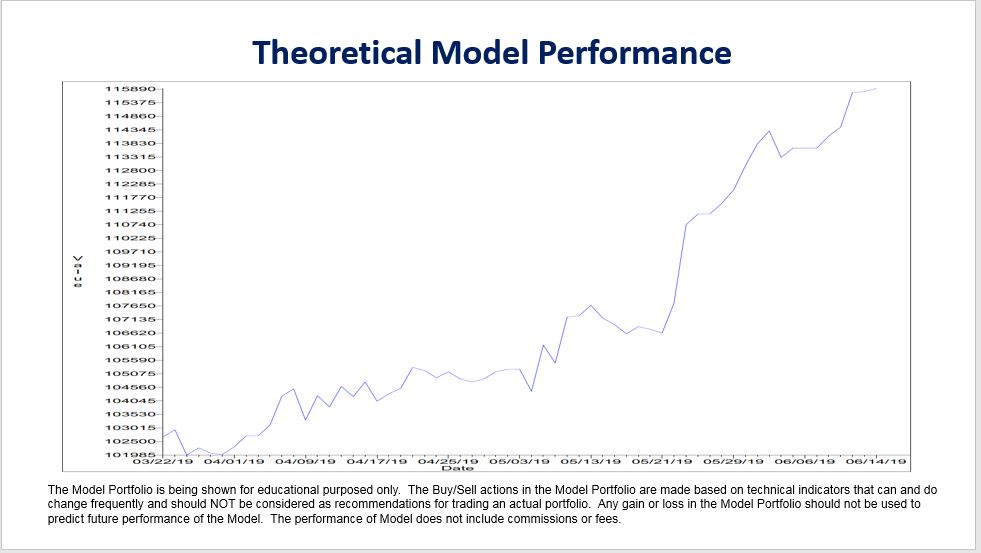
After yesterday’s session, the Model’s cash position was $79,132. The Model has now gained $15,874 since inception or 15.87 percent which translates to an annualized IRR of 63.75 percent. For comparison, the unmanaged SPX is currently showing a gain of 1.1 percent during the same period. The Model’s equity chart and trading statistics are attached for your review.
BTW, one of the things I was doing yesterday now that gold appears to be starting its uptrend up is Rifle Trading. This is a strategy that I employ for my trading accounts (not with the Model) whenever I believe a security is entering a Major Uptrend. Basically, I buy a basic position and then trade a half position whenever the 2-period RSI becomes oversold and then sell this half position when the RSI becomes overbought. It’s an extremely effective way to generate additional profits. I do this whenever I see the 35-period CCI enter the trend mode on the Daily Chart, as it is now for gold (GLD). So, with gold in an uptrend on the Daily, I simply trade a chart with a shorter time period, like the 15s or 60s. Yesterday, because it is still early in gold’s uptrend, I was trading the 15s. I was using NUGT as my trading vehicle and must have traded it 3-4 times, each one generating a small profit. At the end of the day, those 3-4 trades added up to a nice daily profit :>)
The Model continues to watch Bonds. Yesterday, Bonds rose slightly again with TMF gaining 0.24 cents to 24.32. While Bonds are still OK, I’m beginning to see negative divergences in the volume indicators. As long as TMF and TLT remain on the Dean’s List, the current low interest rate environment should continue to support the equity markets. However, IF TMF and TLT are replaced on the Dean’s List by TBT, the inverse Bond ETF, it will be time to start looking for inverse index ETFs.
The Model Portfolio is being shown for educational purposed only. The Buy/Sell actions in the Model Portfolio are made based on technical indicators that can and do change frequently and should NOT be considered as recommendations for trading an actual portfolio. Any gain or loss in the Model Portfolio should not be used to predict future performance of the Model.
Have a great weekend.
That’s what I’m doing,
h

Market Signals for
06-17-2019
| DMI (DIA) | POS |
| DMI (QQQ) | POS |
| A/D OSC | |
| DEANs LIST | POS |
| THE TIDE | POS |
| Index | Signal | Signal Date |
|---|---|---|
| DOW | POS | 05 Jun 2019 |
| NASDAQ | POS | 13 Jun 2019 |
| GOLD | POS | 03 Jun 2019 |
| U.S. DOLLAR | NEU | 14 Jun 2019 |
| BONDS | NEU | 10 Jun 2019 |
| CRUDE OIL | NEU | 14 Jun 2019 |
Only getting the Professor’s Weekend Review? Try his daily update Cum Laude service for 2 weeks only $9.99 LEARN MORE
All of the commentary expressed in this site and any attachments are opinions of the author, subject to change, and provided for educational purposes only. Nothing in this commentary or any attachments should be considered as trading advice. Trading any financial instrument is RISKY and may result in loss of capital including loss of principal. Past performance is not indicative of future results. Always understand the RISK before you trade.

Category: Professor's Comments, Weekend Strategy Review