
Weekend Strategy Review July 28, 2019
Posted by OMS at July 28th, 2019
The markets were mildly higher on Friday. It appears that traders were waiting to see what the Fed would do with interest rates at their policy meeting next week. The Dow finished with a gain of 51 points, closing at 27,192. It was up 38 points on the week. The NASDAQ was up 92 points on Friday, and up 184 points for the week.
Friday’s rally caused the market timing indicator on the Dow to turn Positive, joining the NASDAQ, SPX, and Russell 2K on a Buy Signal.
The Tide also turned positive after Friday’s session. The Dean’s List and Money Flow indicators remain positive.
Last week, the CCI on the Dow fell below the 100 level, taking it out of the Trend Zone. It stayed below 100 all week, finishing at 80.18 as the market traded sideways. So now that the CCI is below 100 it should respond to overbought and oversold conditions on the 2-period RSI. And that’s pretty much what we saw on Friday as the Dow rallied from an oversold reading of 21.35 on Thursday to finished with a reading of 46.24 on Friday. The reason I mention this is because with a reading of 46.24, the Dow is not overbought, so with NO Trend in place, it’s likely the market will rally into Wednesday’s Fed announcement. What happens after that remains to be seen?
Also, as I mentioned last week, students should note that even though the CCI has moved out of the Trend Zone, the indicator is still well above the zero line. So, until the CCI turns negative, the markets will likely continue to chop around as they develop the top. Markets tend to develop tops more slowly than bottoms. That’s why I believe we’ll likely see more back and forth trading with a possible re-test of last week’s high. Then once the CCI (the momentum) turns negative, the down slide will begin. This could begin right after the Fed announcement on 31 July. So, start thinking about what you’re going to do if you see this happen. It’s also possible, but not likely, that the top (27,399) is already in.
As for possible downside targets, it still appears that once the Dow tops and the CCI turns negative, the pattern (a small Ending Diagonal) suggests the Dow will decline to the 3 June low of 24,680. But after that, things are still up in the air. If 24,680 doesn’t hold, it’s almost certain that the 26 December low of 21,713 will be tested. The reason I say this is because the rise since 26 December has been a large five wave Ending Diagonal Pattern, and the target for an ED is where it began.
On the other hand, IF the Dow’s next decline holds above 24,680, its likely that the decline will only be Wave ‘B’ down of a 3 wave decline with Wave ‘C’ up to follow sometime later this year or into 2020. At this point, I believe the odds for a significant decline (more than 2,400 Dow points) are high, but this decline might not be the end of the Bull Market. We won’t know until after we see how the decline develops.
And that’s why we can’t take the chance. Once the Dow starts down, if the momentum begins to pick up, it will be easy for the market to break below the 3 June low. And if this happens, the first leg down of the new Bear Market will be underway. So, pay attention to the CCI on the Daily chart of the Dow and the market timing signals next week. If they begin to turn Negative, it will be time to start managing your money
The Sector Ratio remained at 16-8 Positive after Friday’s session. The Strong Sector List was led by Semiconductors, Household Products, Healthcare, Material (includes gold), and Insurance. The Weak Sector List was led by Energy, Service, Retail, Utilities, and Autos.
Model Portfolio: The Model was stopped out of its shares of TBT on Friday at a price of 29.50. The Model still holds 500 shares of NUGT, a 3X leveraged ETF for the Gold Miners and 800 shares of UGL, a 2X leveraged ETF for gold.
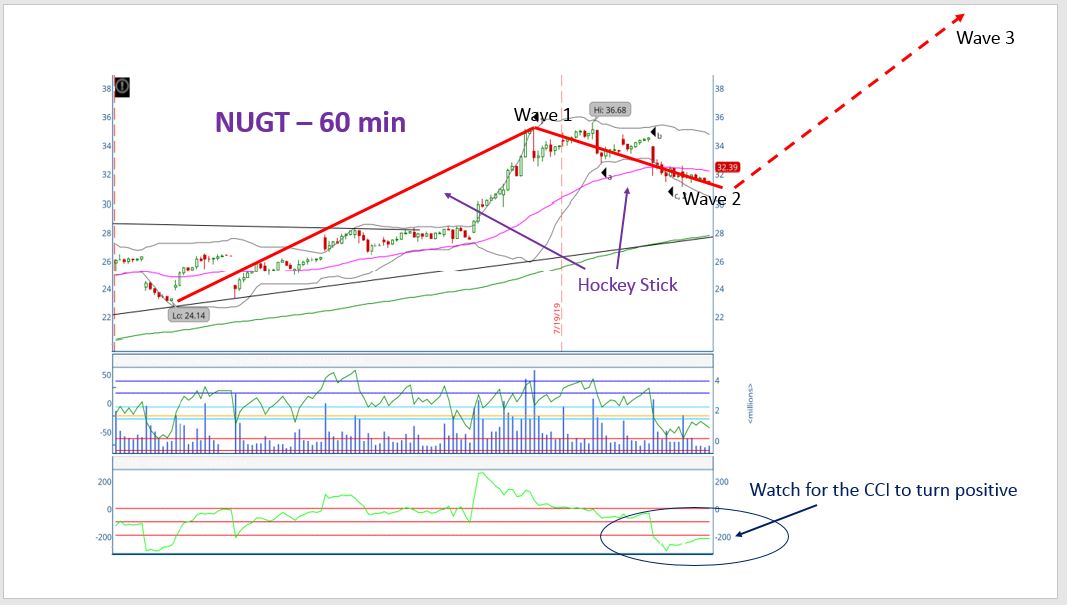
BTW, the trade in NUGT that I mentioned on Friday was not executed as the CCI on the short-term bars never turned positive. (see 60 min chart attached)
After Friday’s session, the Model is up about 20 percent which translates to an annualized gain of about 55 percent. The Model continues to hold a lot of cash ($68,574) waiting for high probability opportunities to put the cash to work. If the timing signals on the Dow and NASDAQ turn negative next week, the Model will start looking to buy shares of DXD and QID.
Crude Oil continues to look like an iffy trade. If the 2-period RSI on SCO, the inverse ETF for West Texas Crude, becomes oversold next week, the Model would likely buy a few shares. But right now, with tension running high in the Persian Gulf, crude is not a high probability trade. Crude continues to work its way through a large triangle, that eventually …like several months from now, should begin to move higher. But even this is questionable as a slowing economy will put pressure on crude prices. That’s why the Model is focusing more on gold which is already in a longer-term Wave 3 up pattern. I still view any pullback in gold or mining shares as an opportunity to add to a position.
On Friday, the Gold Miners Index (HUI) fell to a low of 205.34 before bouncing to close at 206.9. The 205 level was the level was where I had my target for the completion of Wave 2 down. So once again, watch the CCI on the 30 and 60 min bars on the HUI and NUGT…especially as we get closer to Wednesday’s Fed Meeting.
BTW, it you’re interested in gold (the metal) my target for the completion of wave 2 down on GLD is the 132 -133 level. In other words, Thursday’s pullback to 133.09 was close. Remember, I’m assuming the current pullback is wave 2 down within a five wave sequence for Wave 5 up. So, IF gold begins to rally next week, the rally should be impulse wave 3 of Wave 5 up. I love to trade wave 3’s :>) My target for wave 3 up in gold (the metal) is above the 1500 level, with 1600-1650 likely after all five waves of Wave 5 up are complete.
The Model Portfolio is being shown for educational purposed only. The Buy/Sell actions in the Model Portfolio are made based on technical indicators that can and do change frequently and should NOT be considered as recommendations for trading an actual portfolio. Any gain or loss in the Model Portfolio should not be used to predict future performance of the Model.
Have a great weekend.
That’s what I’m doing,
h
Market Signals for
07-29-2019
| DMI (DIA) | POS |
| DMI (QQQ) | POS |
| A/D OSC | |
| DEANs LIST | POS |
| THE TIDE | POS |
| Index | Signal | Signal Date |
|---|---|---|
| DOW | POS | 26 Jul 2019 |
| NASDAQ | POS | 24 Jul 2019 |
| GOLD | NEU | 22 Jul 2019 |
| U.S. DOLLAR | POS | 22 Jul 2019 |
| BONDS | NEG | 17 Jul 2019 |
| CRUDE OIL | NEG | 24 Jul 2019 |
Only getting the Professor’s Weekend Review? Try his daily update Cum Laude service for 2 weeks only $9.99 LEARN MORE
All of the commentary expressed in this site and any attachments are opinions of the author, subject to change, and provided for educational purposes only. Nothing in this commentary or any attachments should be considered as trading advice. Trading any financial instrument is RISKY and may result in loss of capital including loss of principal. Past performance is not indicative of future results. Always understand the RISK before you trade.

Category: Professor's Comments, Weekend Strategy Review