
Weekend Strategy Review January 21, 2018
The markets finished the week with a moderate rally. The Dow was up 54 points, closing at 26,072. The large cap index was up 269 points for the week, but finished off its rally high of 26,153. The NASDAQ and SPX were also up on the week, gaining 75 and 24 points, respectively.
Looking at the indicators this weekend, there is still nothing in any of the indicators I monitor to suggest the current up trend in the market is over. Last week I talked about how the market would rally as long as the fat lady continued to sing. As of Friday, she’s still singing.
The only negative I see this weekend is with the 2-period RSI. If you look at the indicator on the Dow closely, you will see that it is starting to diverge from price. In other words, as the Dow has been making higher highs, the 2-period RSI is not moving up with it. I call this an RSI ‘Hook’. It’s a warning that a short-term top is approaching. The sell signal on the ‘Hook’ comes when its value crosses below the 70 line. As of Friday, the 2-period RSI was showing a reading of 75.62.
On the other hand, my combination VTI-volume indictor is still on a Buy Signal. So, until this indicator turns negative, any Sell Signal generated by the RSI ‘Hook’ will only be a short-term pullback. And if the RSI drops below the 30 level, it will likely be a buying opportunity more than anything else. Remember, my combination VTI-volume indicator turned positive on 29 August when the Dow was at 21,865. The indicator is still very strong, and you won’t see me turning off the Opera House lights until it turns negative.
The Sector Ratio is also strong. After Friday’s trading, the Ratio stayed at 20-4 positive. The Strong Sectors were led by Retail, FoodDrugs, Healthcare, Consumer Products and Transportation. The four weak sectors were Utilities, Real Estate, Insurance and Telecoms. If you owned stocks or ETFs in the top strong sectors, you had another nice week. If you owned the Utes, you’re probably wondering “How can the Utilities keep going down when the overall market keeps going up by several hundred points every week?” The explanation is pretty simple. The large cap stocks in the Dow are adjusting to the ‘gift’ of the 40+ percent tax break they just got. This tax break makes their bottom line earnings look better. The Utes are not benefiting as much from the tax cut and are starting to feel the pressure of rising interest rates. It’s the same thing with stocks and REITS in the Real Estate sector. The Telecoms are also interest rate sensitive.
Students can not only see this by watching the Weak Sector List, but by noting that TBT has replaced TMF and TLT on the Dean’s List. My combination VTI-volume indicator generated a Sell Signal on TMF on 18 January. The same indicator generated a Sell Signal on TLT on 8 January. So, the two Bond ETFs I trade are now on Sell Signals. And as Bond prices fall, interest rates go up. So, we should expect that any stock or sector that is interest rate sensitive, like the Utes and Real Estate, will be having a tough time of it.
This is why I continue to say….stay in stocks and ETFs in the strong sectors and avoid those in the weak ones. It pay$.
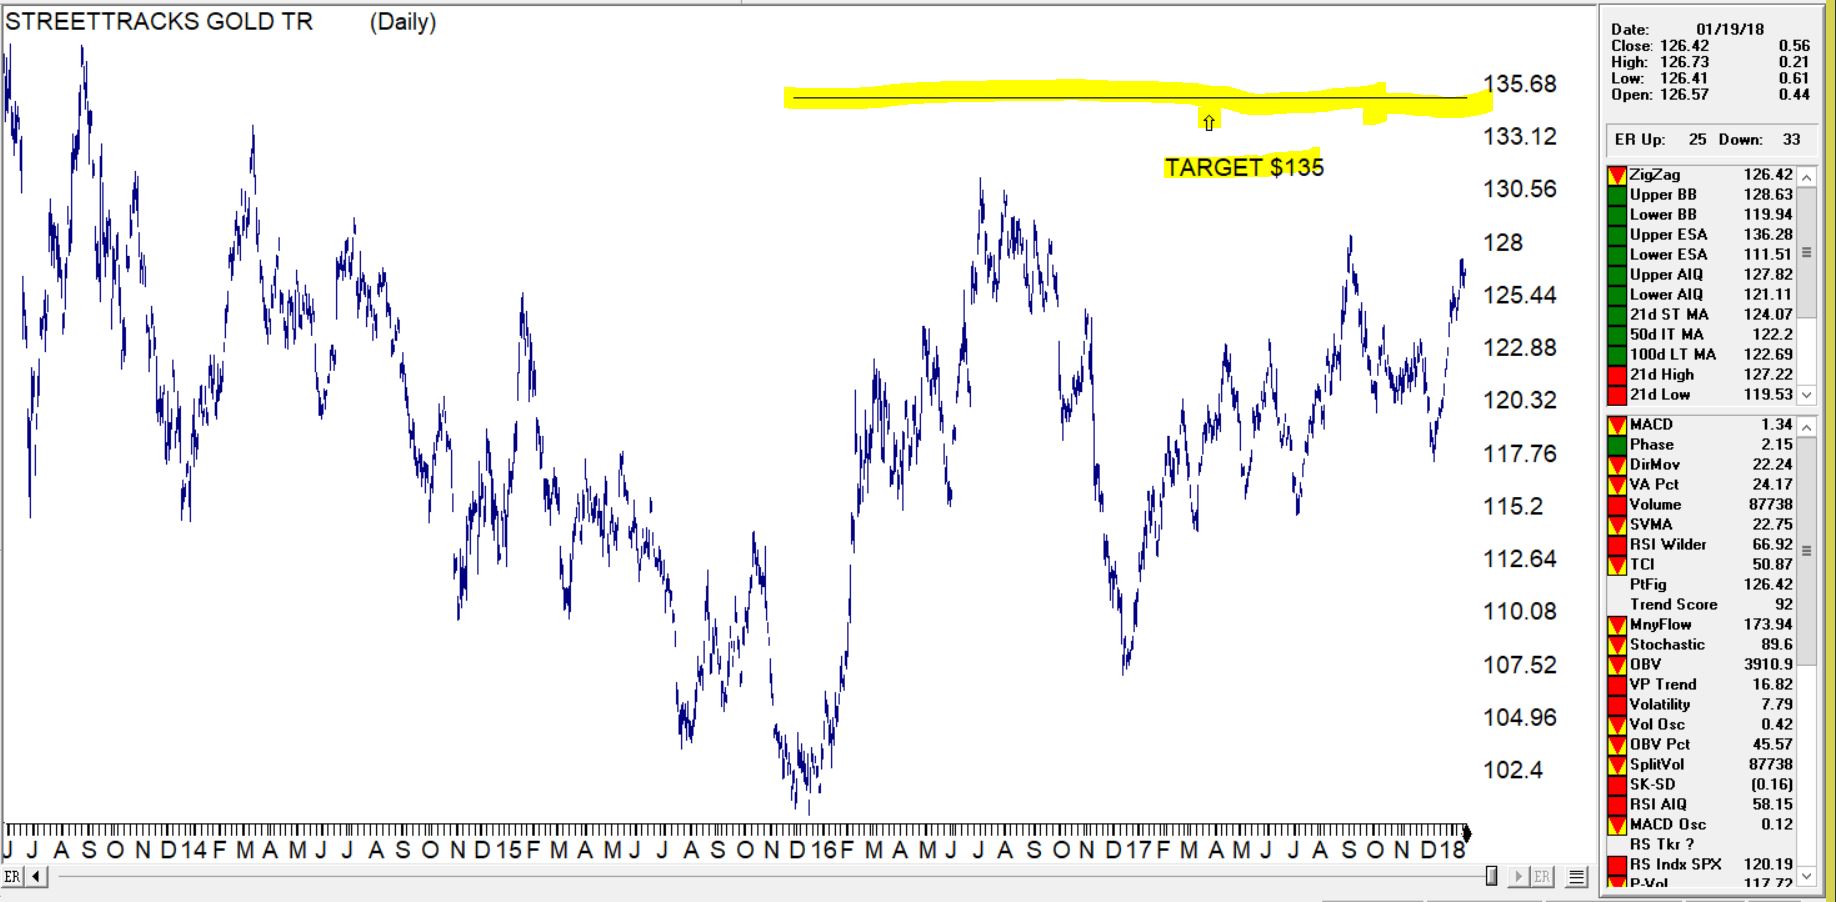
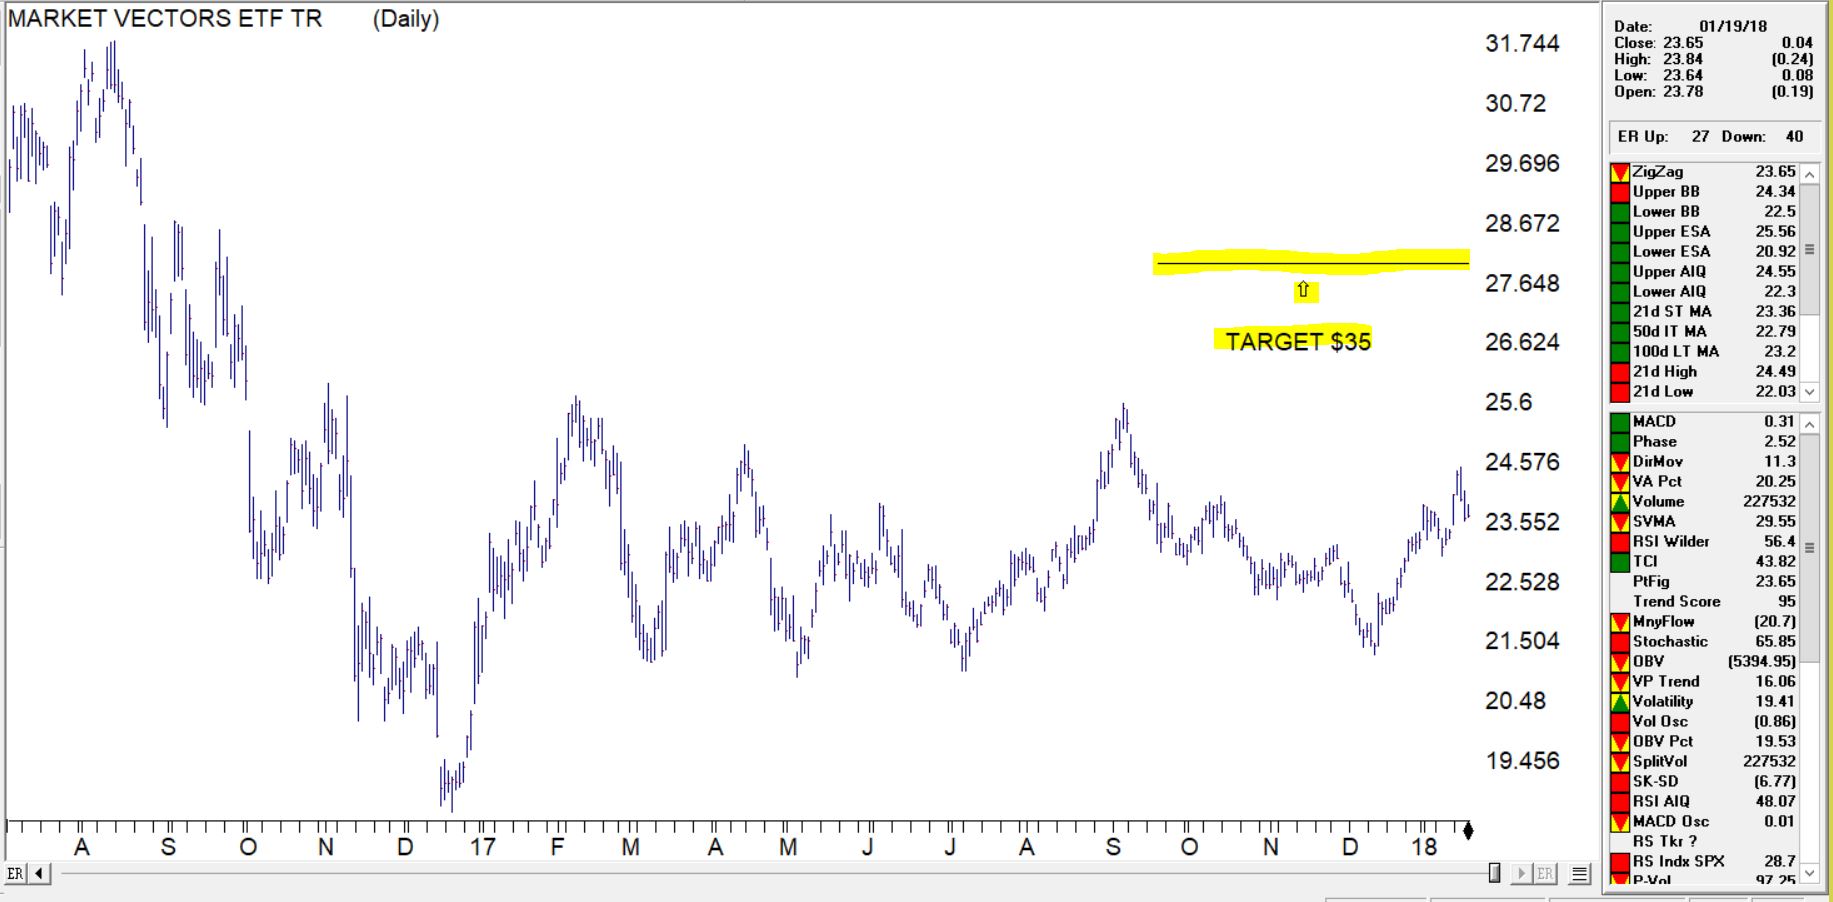
BTW, I bought a few shares of GDX on Friday as a Rifle Trade. The ETF remains in an Up Trend and the 2-period RSI was oversold. As long as gold stocks and ETFs remain in Up Trends, I will continue to add shares anytime the 2-period RSI is oversold.
Have a great weekend.
That’s what I’m doing,
h
Market Signals for
01-22-2018
| DMI (DIA) | POS |
| DMI (QQQ) | POS |
| COACH (DIA) | POS |
| COACH (QQQ) | POS |
| A/D OSC | |
| DEANs LIST | POS |
| THE TIDE | NEU |
| SUM IND | NEG |
| VTI | POS |