
Weekend Strategy Review February 9, 2020
Posted by OMS at February 9th, 2020
Weekend Strategy Review 020820
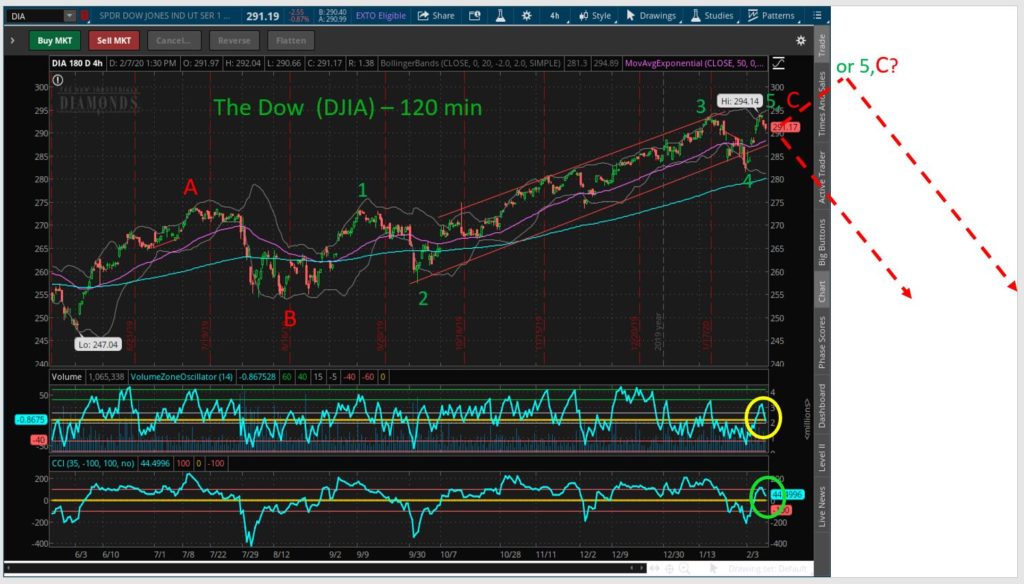
Dow 30,000? Maybe…or maybe not.
In Thursday’s Comments I mentioned that it was starting to look like the decline into the 31 January low of 28,161 was NOT Wave 1 down of a new Bear Market, but rather Wave 4 down of the old Bull. All this could have changed with Friday’s decline.
Friday’s 277 point decline o the Dow didn’t change any of the Market Timing Indicators. They’re all still positive. But the thing that was important about the decline was that it came immediately after the Dow gapped higher at the open on Thursday. The large decline after Thursday’s gap open formed a Star Reversal Candlestick Pattern on the daily chart. Reversal Patterns like this are NOT supposed to occur near the start of a new leg for a Bull Market. Instead, they usually mark the completion of a rally leg, which in this case would be retracement Wave 2 up of the new Bear.
This is a Big Deal! Recall what I said on Thursday. “What I’m telling you is that while the odds have shifted toward the Bullish side for now, it’s NOT clear where the current rally leg will end. It could be anywhere between 29,400to 30,000. This will make trading problematic in the weeks ahead.” Friday’s high was 29,408!
At this point, I still don’t know. But IF Friday’s reversal marked the completion of Wave 2 up, the trading action during the next few days should be telling. Here’s what I’m looking for:
1. Five waves down. Friday’s decline consisted on 5 waves down from its high of 29,408 on an hourly chart. Anytime I see 5 waves down on an hourly chart I MUST begin to look for a change in trend.
2. Impulsive declines. Friday’s decline was impulsive. This means the decline was either part of Wave 1 down of Major Wave 3 down or wave ‘c’ down within an a-b-c correction. If it’s the first case, the Dow should continue to fall hard after a small bounce. A large impulsive decline that changes the Market Timing Signals would be extremely negative now. It would be my signal to get aggressively short.
3. VTI-RSI Signal and Breadth Indicators: In Thursday’s Comments I mentioned that the 2-period RSI was overbought with NO TREND in place and would likely pull back. I used the pullback to exit the Model’s short positions, before the Dow rallied to its new high. After yesterday’s session the 2-period RSI fell to 43.41, which is still not oversold, with NO TREND in place. In other words, the Dow could still decline before it becomes oversold. Yesterday’s decline also caused the A-D oscillator to turn negative again, so now the Up-Down oscillator AND the A-D oscillator are negative. Markets don’t usually go on a Bullish tear when these two indicators are negative. In fact, the reverse is true. So right now, 2 of the 4 breadth indicators that make up The Tide are negative. If the Hi-Lo indicator and the Summation Index turn negative, they too would tend to confirm the top is in.
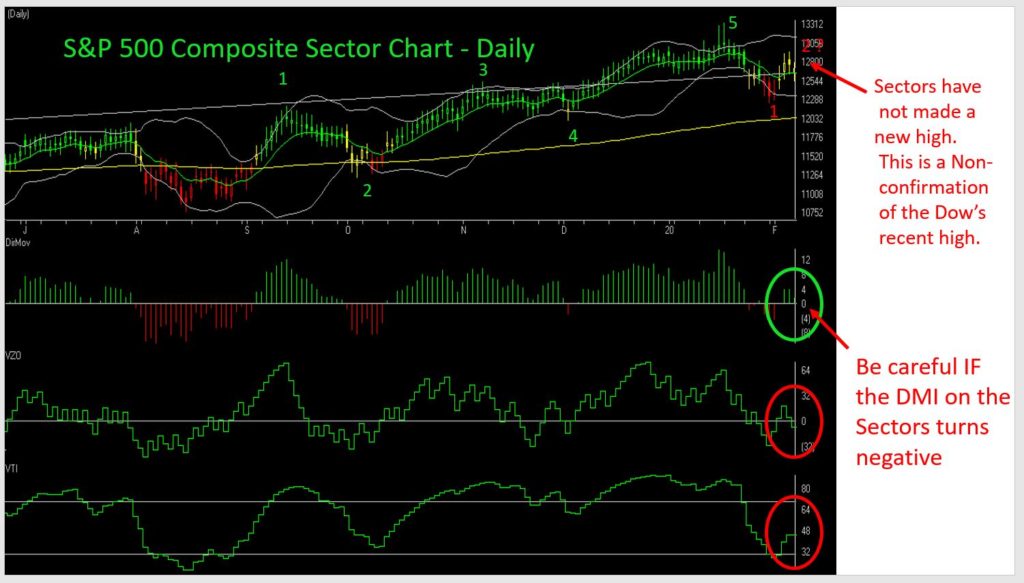
4. The Sector Ratio fell to 14-10 Negative. One of the things that had me cautious about a move toward the 30,000 level was the Sector Ratio. It was still neutral (10-14 Positive) on Thursday. I felt and continue to feel that IF the Dow is going to rally to 30,000, more sectors need to participate. This is NOT occurring. As a matter of fact, the Sector Index Chart, a custom composite chart of all 24 sectors that I generate, shows that the sectors topped on 17 January and that everything since appear to be of Waves 1 and 2 of a new declining trend. So, the sectors are telling a different story than the Dow.
So, while the Market Timing Indicators for the Dow, NASDAQ, SPX (SPY) and Russell 2K remain on Buy Signals this weekend, we need to be on the alert for changes. Same for the Dean’s List which remains Positive with a Neutral Tide. The DMI’s on the on the Dow and NASDAQ-100 (QQQ) are Positive. (Just barely positive on the Dow).
Again, the Sector Ratio is now 14-10 Negative after Friday’s session. The Strong Sector List was led by Household Products, Food, Cap Goods, Insurance and Computers. BTW, five of the Sectors on the Strong List only have RS Ratings of Zero! Hmmm? The Weak Sector List was led by Autos, Service, Leisure, Material and Media. BTW, the RS Ratings of the 14 sectors on the Weak List are a lot weaker than the RS ratings of the Sectors on the Strong List are strong. So overall, the Sector Ratio is a lot weaker than the 14-10 Ratio would suggest. And like I said on Thursday, the top two sectors on the Strong List, Household Products and Food, are NOT sectors that I associate with a raging Bull.
Recall what I said on Thursday that this was almost the same situation that occurred on 30 January when the Sector Ratio was at 15-9 Positive with Household Products (#1) and Food (#3) topping the List. The next day the Dow fell over 600 points. Interesting that the Dow fell 277 points on Friday.
Model Portfolio: The Model is currently 100 percent in cash. If the Market Timing Signals turn negative, the Model will begin to establish inverse (short) positions.
Right now, I’m just waiting to see what happens on Monday.
That’s what I’m doing.
h
The Model Portfolio is being shown for educational purposed only. The Buy/Sell actions in the Model Portfolio are made based on technical indicators that can and do change frequently and should NOT be considered as recommendations for trading an actual portfolio. Any gain or loss in the Model Portfolio should not be used to predict future performance of the Model.
P.S. Microsoft did me in with their Updates this morning. It took over 4 hours to get the updates done. I wonder if any of this is related to what’s going on in Iowa? Just kidding….
Market Signals for
02-10-2020
| DMI (DIA) | POS |
| DMI (QQQ) | POS |
| A/D OSC | |
| DEANs LIST | POS |
| THE TIDE | NEU |
| Index | Signal | Signal Date |
|---|---|---|
| DOW | POS | 05 Feb 2020 |
| NASDAQ | POS | 04 Feb 2020 |
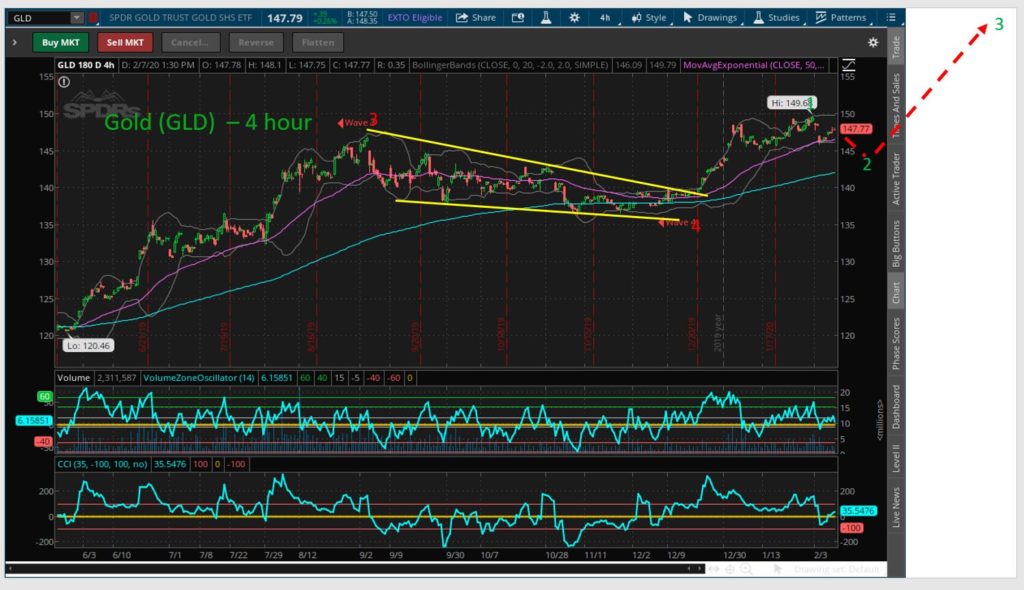
| GOLD | POS | 17 Jan 2020 |
| U.S. DOLLAR | POS | 31 Jan 2020 |
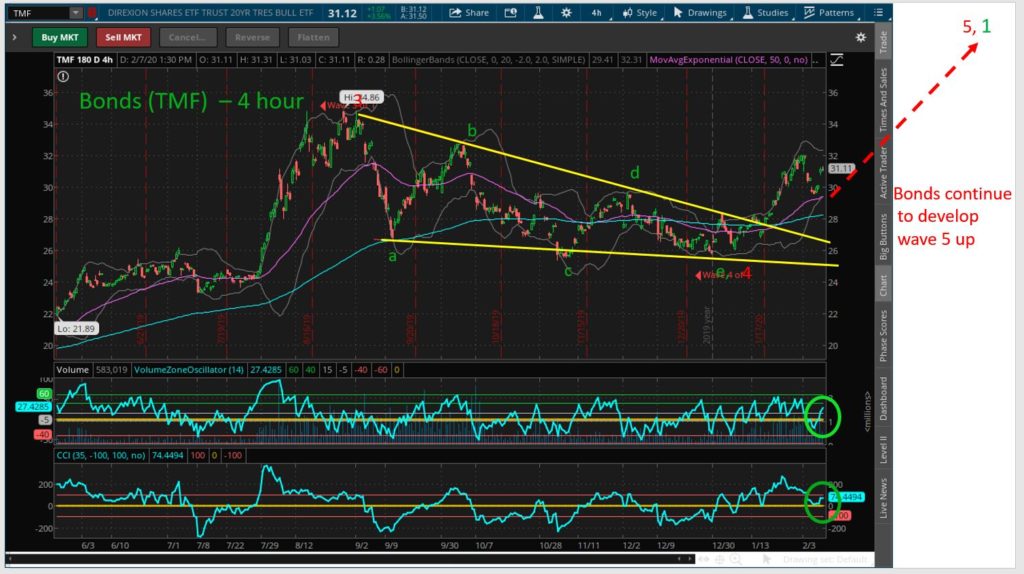
| BONDS | POS | 07 Feb 2020 |
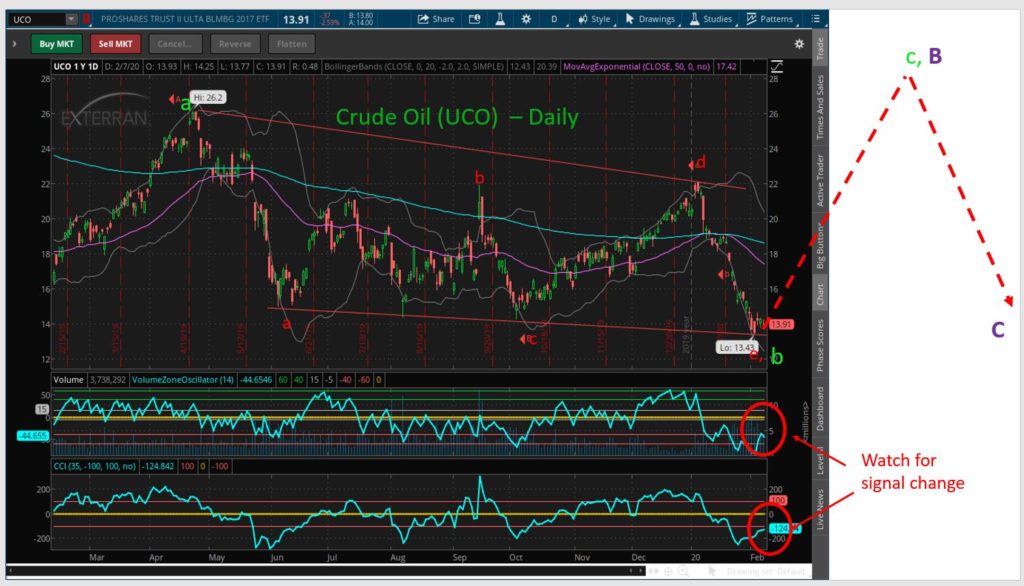
| CRUDE OIL | NEG | 10 Jan 2020 |
DISCLAIMER
As always, the Professor never makes recommendations. The information is provided on an educational basis so you can have informed discussions with your financial advisors and/or accountants about your individual investment decisions.
All of the commentary expressed in this site and any attachments are opinions of the author, subject to change, and provided for educational purposes only. Nothing in this commentary or any attachments should be considered as trading advice. Trading any financial instrument is RISKY and may result in loss of capital including loss of principal. Past performance is not indicative of future results. Always understand the RISK before you trade.

Category: Professor's Comments, Weekend Strategy Review