
Weekend Strategy Review April 7, 2019
Posted by OMS at April 7th, 2019
The markets were up mildly on Friday, continuing their upside breakout from their triangle patterns. The Dow finished up 40 points on Friday and was up 496 points for the week. The NASDAQ gained 47 points on Friday and was up 208 points on the week.
The recent consolidation triangle pattern for the Dow was likely Wave 4, so if this is the case, Wave 5 up should take the Dow to the 27,000 level with 27,500 possible. Students should realize that the rise to 27,000+ will NOT likely be straight up. This is because IF the Dow is headed toward 27,000+, it will more than likely have to do it in a series of up-down-up moves that will form an Ending Diagonal Pattern. Ending Diagonals are termination patterns that usually mark the end of a significant move. In this case, especially with an inverted yield curve on the Board, the Ending Diagonal will likely mark the end of the Bull Market. This is NOT an immediate concern as the indicators and Lists are far to Bullish to be worried about a Bear Market for now. On the other hand, we know that Ending Diagonal Patterns can truncate at any time, so the Dow does not have to go to 27,000. This is why we need to pay attention to the market timing signals on the cockpit.
There were NO CHANGES to the market timing indicators after yesterday’s session. The Dow, NASDAQ, SPX, and Russell 2K remain on Buy Signals.
The Sector Ratio increased to 22-2 positive after yesterday’s session. The Strong List continues to be led by Real Estate, Household Products, Semiconductors, Technology, and Computers. The two weak sectors were FoodDrugs and Banks. The fact that the Sector Ratio remains strong supports the Bullish case for the intermediate trend.
Model Portfolio: The Model continues to hold a full position in DDM (538 shares), a full position (370 shares) in UWM, the positive ETF for the Russell 2K, and a half position (635 shares) in UCO, the ETF for Crude Oil. The remainder of the theoretical $100,000 Model Portfolio remains in cash ($36,861).
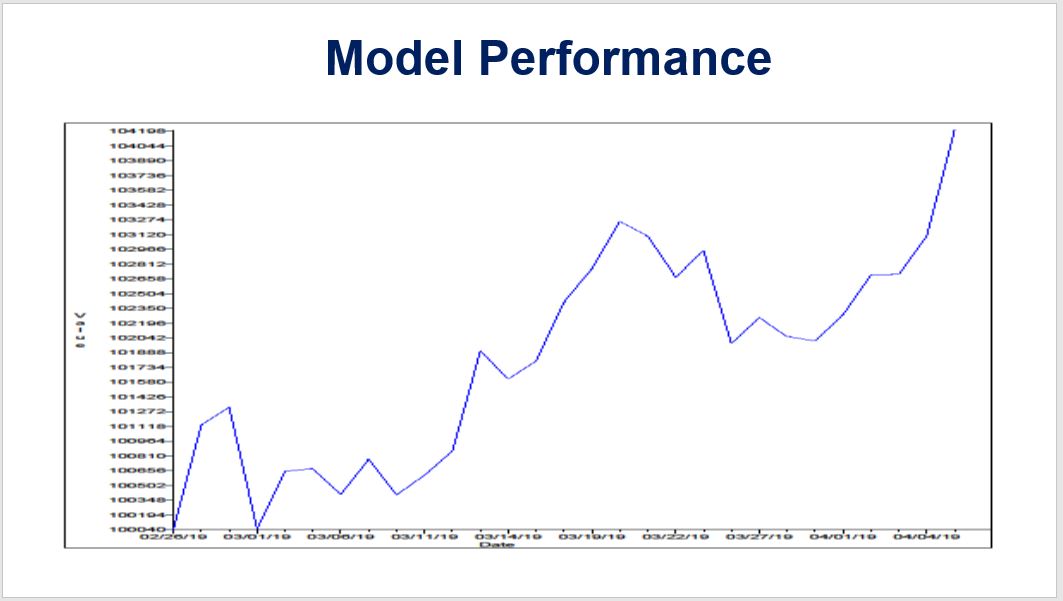
The Model Portfolio has gained $4,207 since inception, even though the conditions that the Model was designed to take advantage of (a trending market) have not occurred to date. I am attaching a chart of the Model’s cumulative performance in this week’s WSR so students can see how the model performed while the market was in its consolidation triangle.
Students should also note that the Model remains void of gold, as it waits for corrective Wave 2 down in GLD to complete. Once this wave completes, gold should generate a Buy Signal that could take the metal to the 1,600 level. Be patient.
The Model Portfolio is being shown for educational purposed only. The Buy/Sell actions in the Model Portfolio are made based on technical indicators that can and do change frequently and should NOT be considered as recommendations for trading an actual portfolio. Any gain or loss in the Model Portfolio should not be used to predict future performance of the Model.
Have a great weekend.
That’s what I’m doing,
h
Market Signals for
04-08-2019
| DMI (DIA) | POS |
| DMI (QQQ) | POS |
| A/D OSC | |
| DEANs LIST | POS |
| THE TIDE | POS |
| Index | Signal | Signal Date |
|---|---|---|
| DOW | POS | 01 Apr 2019 |
| NASDAQ | POS | 13 Mar 2019 |
| GOLD | NEG | 01 Apr 2019 |
| U.S. DOLLAR | NEU | 28 Mar 2019 |
| BONDS | NEU | 01 Apr 2019 |
| CRUDE OIL | POS | 26 Mar 2019 |
Only getting the Professor’s Weekend Review? Try his daily update Cum Laude service for 2 weeks only $9.99 LEARN MORE
All of the commentary expressed in this site and any attachments are opinions of the author, subject to change, and provided for educational purposes only. Nothing in this commentary or any attachments should be considered as trading advice. Trading any financial instrument is RISKY and may result in loss of capital including loss of principal. Past performance is not indicative of future results. Always understand the RISK before you trade.

Category: Professor's Comments, Weekend Strategy Review