
Professor’s Comments September 30, 2014
Posted by OMS at September 30th, 2014
The Dow fell hard early, opening down almost 180 points before recovering to finish down 42 points at 17,071. Volume on the decline was still fairly light, coming in at 94 percent of its 10-day average. However the volume did increase slightly from Friday’s session (94 vs. 91 percent) which is not what you want to see if you’re Bullish. On a potential reversal day like yesterday, long betters would have liked to see the volume dry up. But it didn’t. It actually increased! This could spell trouble ahead. There were 29 new highs and 177 new lows.
After yesterday’s early decline, it appeared that the corrective bounce took the form of an a-b-c retracement. If I’m right about this, it would mean that the retracement was corrective wave 2, and that an impulsive decline for wave 3 down should be next.
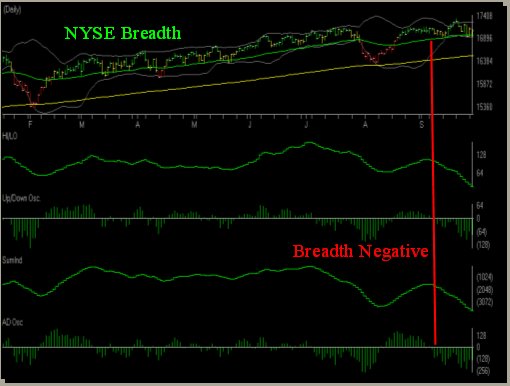
The Dean’s List remains negative and the Tide continues to recede. I have included an updated Tide Chart with today’s Comments so you can see how the Breadth remains negative. It NEVER pays to trade against the Tide. At the end of the day, Breadth usually wins.
At this point, I’m about 50 percent invested in inverse ETFs. The only thing that is keeping me from adding to my inverse holdings is the volume. I’m still not seeing the kind of high volume sell-offs that would tell me the institutions are throwing in the towel. The Big Boys continue to dump stocks, but they are doing it in a very controlled fashion. This tells me that they still have a lot of stock on their shelves that they haven’t been able to unload to the general public yet. And every time stocks start to sell off, some institution steps in to keep prices from declining rapidly.
Yesterday, the A-D oscillator had a very small change of less than 6 points, so we need to be on the lookout for a Big Move within the next 1-2 days. Given yesterday’s sharp early morning decline and late day retracement, the Big Move could be the impulse wave 3 down. Be extremely careful with your trading now. The pattern on the Dow still suggests a move down to the 16,350 -16,400 level.
As long as the Dean’s List and the Tide remain negative, there is a possibility that the market topped on 9 September and that a new Bear Market has started. A few days ago, I mentioned that as long as the SPX remains below the 2000 level, this market MUST be traded as if the market topped on 9 September. On the other hand, IF the SPX does rally as a result of the small change, it would mean that the market has NOT topped and will likely trade to 2020+ before topping. In either case, the odds for trading the long side are NOT good at this point, and any rally should be viewed as a selling opportunity.
Looking at the volume data, it appears that this is exactly what the institutions are doing now. I don’t see any reason why you should be buying the stock they want to sell. Maybe I should have used the word “dump”. It would have better conveyed how I really feel.
Looking for opportunities to add to my short (inverse) positions.
BTW, the P-volume on TWM is at the highest level it’s been at in years. It’s pretty obvious that some institution is starting to accumulate these inverse shares.
That’s what I’m doing,
h
| Market Signals for 09-30-2014 |
|
|---|---|
| DMI (DIA) | NEG |
| DMI (QQQ) | NEG |
| COACH (DIA) | NEG |
| COACH (QQQ) | POS |
| A/D OSC | SM CHG |
| DEANs LIST | NEG |
| BREADTH | NEG |
Not sure of the terminology we use? Check out these articles
The Hockey Stick Pattern
The Creation of Waves and Trends
FAQ
All of the commentary expressed in this site and any attachments are opinions of the author, subject to change, and provided for educational purposes only. Nothing in this commentary or any attachments should be considered as trading advice. Trading any financial instrument is RISKY and may result in loss of capital including loss of principal. Past performance is not indicative of future results. Always understand the RISK before you trade.

Category: Professor's Comments