
Professor’s Comments October 28, 2016
Posted by OMS at October 28th, 2016
The Dow fell 30 points, closing at 18,170. Volume was heavy, coming in at 121 percent of its 10-day average. There were 70 new highs and 71 new lows. Notice how the number of new highs and new lows is just about even now?
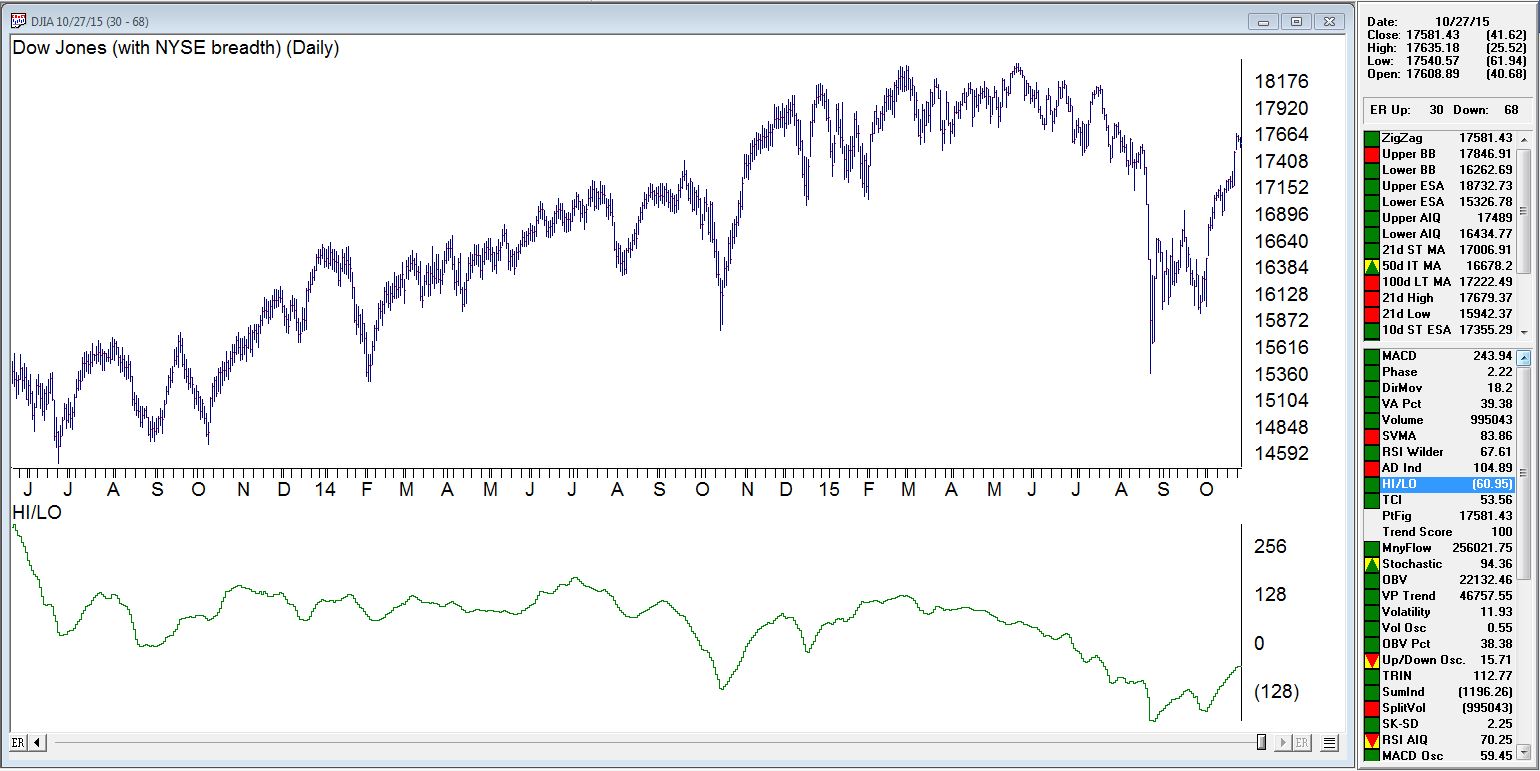
The internals on the NYSE and other major indexes continue to weaken. Yesterday’s breadth and Money Flow readings were the weakest since 14 October and suggest the next move from the current trading range will be down. If 18,050 Is broken, the Dow should test the 17,700 level where it will likely complete wave ‘D’ down. The current pattern suggests that this decline will happen before the election and be followed by a post-election rally.
The Tide and the Dean’s List remain negative. Last night, the VTI on the Dow came in at a neutral 41.4 with the 2-period RSI at 36.3. This means that the Dow still has room to decline today before the 2-period RSI becomes oversold. If the Dow breaks support at 18,050 on this decline, the VTI could fall below the 30 level and enter the Trend Mode. This would suggest the move toward 17,700 is underway.
As long as the Dow continues to trade between 18,050 and 18,300, I will continue to trade (and not hold) index ETFs whenever the 2-period RSI becomes overbought or oversold. However, if the Dow starts to break below 18,050, I will start holding the inverse index ETFs I have purchased for further gains. If the Dow moves down to 17,900, I will start managing money on these inverse index ETFs. I do not plan to hold any inverse index ETFs past next weekend, as the odds for a post-election relief rally (wave ‘E’ up) are high.
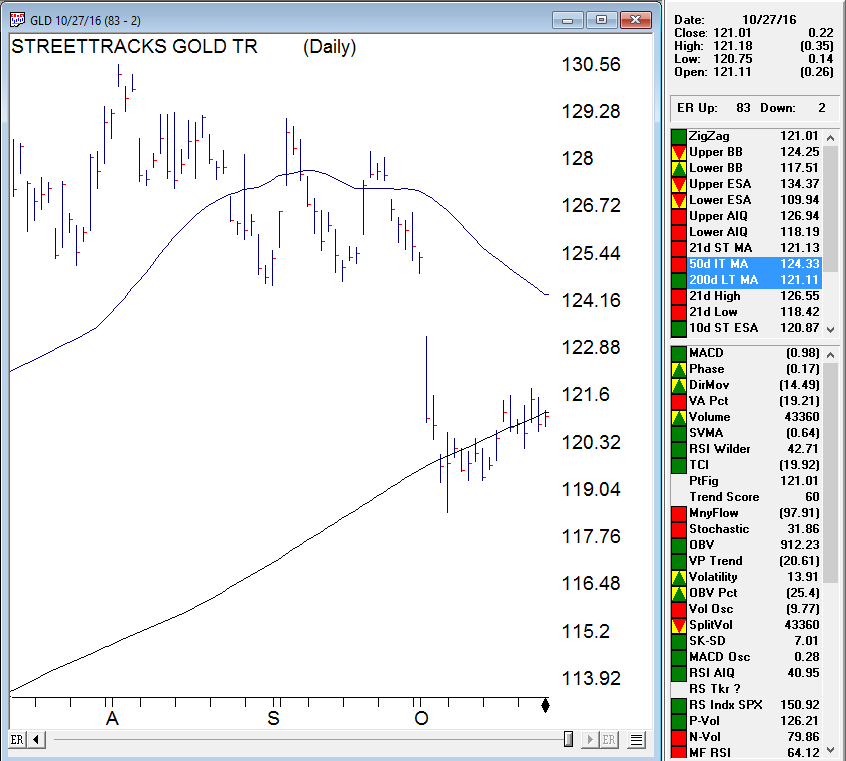
Gold (GLD) continues to trade along its 200-day moving average, currently at the 121.08 level. In other words, GLD appears to be resting. A very small Hockey Stick Pattern has developed because of the move up from the 118 level. This pattern suggests that once the small ‘Blade’ of this pattern completes, GLD should test 50-day moving average resistance at the 123.3 level. If prices can move beyond the 50-day moving average during this test, the ‘Rope Jump’ would be very positive for gold.
Watching,
That’s what I’m doing,
h
| DMI (DIA) | NEG |
| DMI (QQQ) | NEG |
| COACH (DIA) | POS |
| COACH (QQQ) | NEG |
| A/D OSC | |
| DEANs LIST | NEG |
| THE TIDE | NEG |
| SUM IND | NEG |
| VTI | NEG |
One hour video recorded from May 28, 2016 The Professor’s Signs of a Major Market Turn – Prospectives and the Projected Timing and Levels One hour streaming video – includes webinar handouts The Professor usually holds an update class whenever the Market looks like it may be making a major turn. If you have been following the Professor’s Comments you know that a turn is due….. LEARN MORE
Not sure of the terminology we use? Check out these articles
The Hockey Stick Pattern
The Creation of Waves and Trends
FAQ
All of the commentary expressed in this site and any attachments are opinions of the author, subject to change, and provided for educational purposes only. Nothing in this commentary or any attachments should be considered as trading advice. Trading any financial instrument is RISKY and may result in loss of capital including loss of principal. Past performance is not indicative of future results. Always understand the RISK before you trade.

Category: Professor's Comments