
Professor’s Comments January 30, 2020
Posted by OMS at January 30th, 2020
OK, lots if important stuff to cover this morning so let’s get right to it.
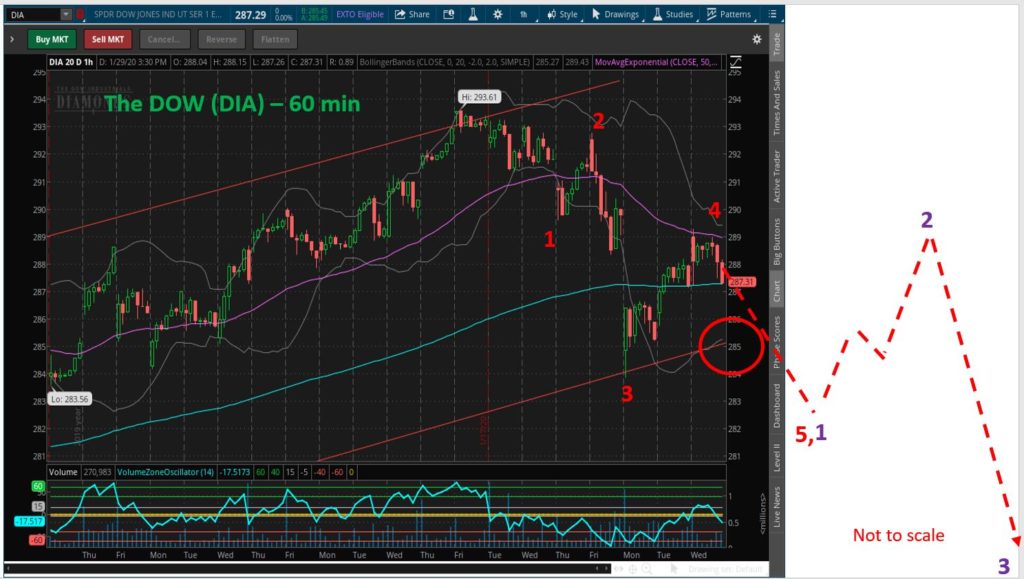
The markets rose for the past two days in what appeared to be a retracement rally from Monday’s low of 28,440. In Tuesday’s Comments I mentioned this potential wave 4 rally would likely take the Dow back to the 28,700+/- level. It got as high as 28,944 before pulling back yesterday afternoon to finish 12 points higher at 28,734. The NASDAQ and SPX performed similarly finishing up 5 and down 3 points, respectively. Volume on the NYSE was moderate, coming in at 100 percent of its 10-day moving average. There were 202 new highs and 59 new lows.
So where are we and what’s the Dow’s next likely move? Well, IF the rally off Monday’s low of 28,440 was in fact retracement wave 4 up, then the markets should continue the decline that began after yesterday’s 2PM Fed announcement. This decline would be wave 5 of Wave 1 down. It should take the Dow below critical channel support at the 28,500 level which would confirm a major trend change in the markets.
In other words, there are two critical items that we need to focus on in the last paragraph. Remember, so far, the Dow has only completed four waves of a possible five wave downward sequence required to establish a trend change. We need to see five waves. Monday’s 454 point decline was IMPULSIVE, so it was likely wave 3 of the sequence. Monday’s decline was followed by a 2-day retracement rally which was likely wave 4 up. So, if the Dow falls below 28,500 now, it will break the lower trend line of the support channel AND do it in five waves. This would confirm a primary trend change which likely means that the top we have been expecting is in.
OK, so what if this DOES NOT happen? Hmmm? This changes the picture considerably, because if the Dow does not move below 28,500 in the next day or so, it means that Wave 5 up of the Bull Market is NOT complete. It means that the decline since the 17 January high of 29,374 is Wave 4 of a five wave sequence of the Bull Market, and that Wave 5 up will likely complete in the late March – April period, probably close to the 30,000 level. So, what happens during the next day or so is critical. This is the reason the Model is still only holding ‘trial’ positions.
BTW, yesterday’s trading action produces another small change in the A-D oscillator, so we need to be on the lookout for a Big Move within the next 1-2 days.
Here’s the thing: If the Big Move is down, it could take the Dow below the 28,500 level. Ideally the decline would complete below the wave 3 low of 28,440. My theoretical target is close to the 28,300 level. IF this happens, I will begin to manage money in the Model, selling most of its inverse index ETF positions and positioning the Model for a Wave 2 retracement rally. After seeing the strength of the past two days of retracement rally, it’s now likely that Wave 2 up will retrace back to the 29,000 level. So, IF the Dow trades down to 28,300, I don’t see any point in continuing to hold inverse positions faced with a potential 700 point rally. IF the Dow approaches 28,350 or so, I’ll begin to take some profit, move to the sidelines, and look to re-establish the inverse positions at higher levels.
After yesterday’s trading, the Dow and Russell 2K remain on Sell Signals. The NASDAQ and SPX are Neutral. The Dean’s List is also Neutral, with QQQ still on the List. The Tide remains Negative.
The Sector Ratio strengthened to 15-9 Positive after yesterday’s session. The Strong Sector List was led by Household Products, Computers, Food, PharmaBio, and Cap Goods. The Weak Sector List was led by Energy, Autos, Materials, Service, and Banks.
Model Portfolio: There were NO CHANGES to the Model after Monday’s session. The Model continues to hold 400 shares of TZA, 300 shares of VXX, 1,500 shares of DXD, 300 shares of SQQQ and 500 shares of TMF with a cash balance of $57,890. The Model is up 31.6 percent after yesterday’s session. Students should look for adjustments to the Model during the next day or so, especially IF the Dow moves below the 28,500 level or above yesterday’s high of 28,944.
BTW, my target for Wave 1 down on the SPX is near the 3205 level. The wave count on the NASDAQ is slightly different as it appears to have completed Waves 1 down and Wave 2 up of a five wave sequence, so the its next move down will likely be a more robust Wave 3 move down. If this is the case, could drop the NASDAQ to the 8,600 level. Yesterday, the small cap index closed at 9,275.
That’s what I’m doing.
h
The Model Portfolio is being shown for educational purposed only. The Buy/Sell actions in the Model Portfolio are made based on technical indicators that can and do change frequently and should NOT be considered as recommendations for trading an actual portfolio. Any gain or loss in the Model Portfolio should not be used to predict future performance of the Model.
Market Signals for
01-30-2020
| DMI (DIA) | NEG |
| DMI (QQQ) | POS |
| A/D OSC | SM CHG |
| DEANs LIST | NEU |
| THE TIDE | NEG |
| Index | Signal | Signal Date |
|---|---|---|
| DOW | NEG | 27 Jan 2020 |
| NASDAQ | NEU | 24 Jan 2020 |
| GOLD | POS | 17 Jan 2020 |
| U.S. DOLLAR | POS | 24 Jan 2020 |
| BONDS | POS | 22 Jan 2020 |
| CRUDE OIL | NEG | 10 Jan 2020 |
Not sure of the terminology we use? Check out these articles
The Hockey Stick Pattern
The Creation of Waves and Trends
FAQ
All of the commentary expressed in this site and any attachments are opinions of the author, subject to change, and provided for educational purposes only. Nothing in this commentary or any attachments should be considered as trading advice. Trading any financial instrument is RISKY and may result in loss of capital including loss of principal. Past performance is not indicative of future results. Always understand the RISK before you trade.

Category: Professor's Comments